PNC Bank 2007 Annual Report Download - page 30
Download and view the complete annual report
Please find page 30 of the 2007 PNC Bank annual report below. You can navigate through the pages in the report by either clicking on the pages listed below, or by using the keyword search tool below to find specific information within the annual report.-
 1
1 -
2
-
3
-
4
-
5
-
6
-
7
-
8
-
9
-
10
-
11
-
12
-
13
-
14
-
15
-
16
-
17
-
18
-
19
-
 20
20 -
 21
21 -
 22
22 -
 23
23 -
 24
24 -
 25
25 -
 26
26 -
 27
27 -
 28
28 -
 29
29 -
 30
30 -
 31
31 -
 32
32 -
 33
33 -
 34
34 -
 35
35 -
 36
36 -
 37
37 -
 38
38 -
 39
39 -
 40
40 -
41
-
42
-
43
-
44
-
45
-
46
-
47
-
48
-
49
-
50
-
51
-
52
-
53
-
54
-
55
-
56
-
57
-
58
-
59
-
60
-
61
-
62
-
63
-
64
-
65
-
66
-
67
-
68
-
69
-
70
-
71
-
72
-
73
-
74
-
75
-
76
-
77
-
78
-
79
-
80
-
81
-
82
-
83
-
84
-
85
-
86
-
87
-
88
-
89
-
90
-
91
-
92
-
93
-
94
-
95
-
96
-
97
-
98
-
99
-
100
-
101
-
102
-
103
-
104
-
105
-
106
-
107
-
108
-
109
-
110
-
111
-
112
-
113
-
114
-
115
-
116
-
117
-
118
-
119
-
120
-
121
-
122
-
123
-
124
-
125
-
126
-
127
-
128
-
129
-
130
-
131
-
132
-
133
-
134
-
135
-
136
-
137
-
138
-
139
-
140
-
141
 |
 |

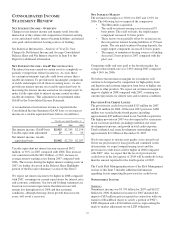
C
ONSOLIDATED
B
ALANCE
S
HEET
R
EVIEW
S
UMMARIZED
B
ALANCE
S
HEET
D
ATA
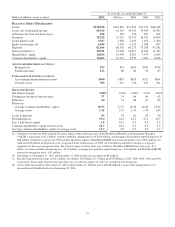
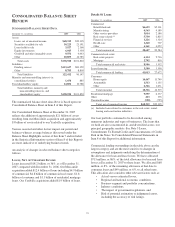
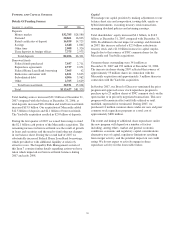
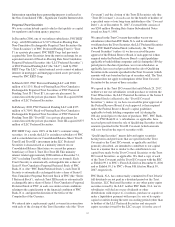
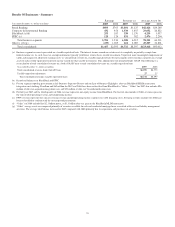
December 31 - in millions 2007 2006
Assets
Loans, net of unearned income $68,319 $50,105
Securities available for sale 30,225 23,191
Loans held for sale 3,927 2,366
Equity investments 6,045 5,330
Goodwill and other intangible assets 9,551 4,043
Other 20,853 16,785
Total assets $138,920 $101,820
Liabilities
Funding sources $113,627 $81,329
Other 8,785 8,818
Total liabilities 122,412 90,147
Minority and noncontrolling interests in
consolidated entities 1,654 885
Total shareholders' equity 14,854 10,788
Total liabilities, minority and
noncontrolling interests, and
shareholders' equity $138,920 $101,820
The summarized balance sheet data above is based upon our
Consolidated Balance Sheet in Item 8 of this Report.
Our Consolidated Balance Sheet at December 31, 2007
reflects the addition of approximately $21 billion of assets
resulting from our Mercantile acquisition and approximately
$3 billion of assets related to our Yardville acquisition.
Various seasonal and other factors impact our period-end
balances whereas average balances (discussed under the
Balance Sheet Highlights section of this Item 7 and included
in the Statistical Information section of Item 8 of this Report)
are more indicative of underlying business trends.
An analysis of changes in selected balance sheet categories
follows.
L
OANS
,N
ET OF
U
NEARNED
I
NCOME
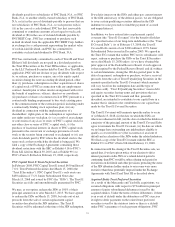
Loans increased $18.2 billion, or 36%, as of December 31,
2007 compared with December 31, 2006. Our Mercantile
acquisition added $12.4 billion of loans including $4.9 billion
of commercial, $4.8 billion of commercial real estate, $1.6
billion of consumer and $1.1 billion of residential mortgage
loans. Our Yardville acquisition added $1.9 billion of loans.
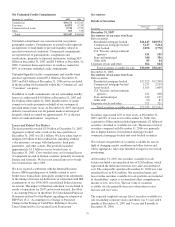
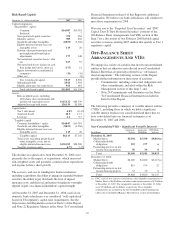
Details Of Loans
December 31 - in millions 2007 2006
Commercial
Retail/wholesale $6,653 $5,301
Manufacturing 4,563 4,189
Other service providers 3,014 2,186
Real estate related (a) 5,730 2,825
Financial services 1,226 1,324
Health care 1,260 707
Other 6,161 4,052
Total commercial 28,607 20,584
Commercial real estate
Real estate projects 6,114 2,716
Mortgage 2,792 816
Total commercial real estate 8,906 3,532
Lease financing 3,500 3,556
Total commercial lending 41,013 27,672
Consumer
Home equity 14,447 13,749
Automobile 1,513 1,135
Other 2,366 1,631
Total consumer 18,326 16,515
Residential mortgage 9,557 6,337
Other 413 376
Unearned income (990) (795)
Total, net of unearned income $68,319 $50,105
(a) Includes loans related to customers in the real estate, rental,
leasing and construction industries.
Our loan portfolio continued to be diversified among
numerous industries and types of businesses. The loans that
we hold are also concentrated in, and diversified across, our
principal geographic markets. See Note 5 Loans,
Commitments To Extend Credit and Concentrations of Credit
Risk in the Notes To Consolidated Financial Statements in
Item 8 of this Report for additional information.
Commercial lending outstandings in the table above are the
largest category and are the most sensitive to changes in
assumptions and judgments underlying the determination of
the allowance for loan and lease losses. We have allocated
$713 million, or 86%, of the total allowance for loan and lease
losses at December 31, 2007 to these loans. We allocated $68
million, or 8%, of the remaining allowance at that date to
consumer loans and $49 million, or 6%, to all other loans.
This allocation also considers other relevant factors such as:
• Actual versus estimated losses,
• Regional and national economic conditions,
• Business segment and portfolio concentrations,
• Industry conditions,
• The impact of government regulations, and
• Risk of potential estimation or judgmental errors,
including the accuracy of risk ratings.
25