PNC Bank 2007 Annual Report Download - page 60
Download and view the complete annual report
Please find page 60 of the 2007 PNC Bank annual report below. You can navigate through the pages in the report by either clicking on the pages listed below, or by using the keyword search tool below to find specific information within the annual report.-
 1
1 -
2
-
3
-
4
-
5
-
6
-
7
-
8
-
9
-
10
-
11
-
12
-
13
-
14
-
15
-
16
-
17
-
18
-
19
-
20
-
21
-
22
-
23
-
24
-
25
-
26
-
27
-
28
-
29
-
30
-
31
-
32
-
33
-
34
-
35
-
36
-
37
-
38
-
39
-
40
-
41
-
42
-
43
-
44
-
45
-
46
-
47
-
48
-
49
-
 50
50 -
 51
51 -
 52
52 -
 53
53 -
 54
54 -
 55
55 -
 56
56 -
 57
57 -
 58
58 -
 59
59 -
 60
60 -
 61
61 -
 62
62 -
 63
63 -
 64
64 -
 65
65 -
 66
66 -
 67
67 -
 68
68 -
 69
69 -
 70
70 -
71
-
72
-
73
-
74
-
75
-
76
-
77
-
78
-
79
-
80
-
81
-
82
-
83
-
84
-
85
-
86
-
87
-
88
-
89
-
90
-
91
-
92
-
93
-
94
-
95
-
96
-
97
-
98
-
99
-
100
-
101
-
102
-
103
-
104
-
105
-
106
-
107
-
108
-
109
-
110
-
111
-
112
-
113
-
114
-
115
-
116
-
117
-
118
-
119
-
120
-
121
-
122
-
123
-
124
-
125
-
126
-
127
-
128
-
129
-
130
-
131
-
132
-
133
-
134
-
135
-
136
-
137
-
138
-
139
-
140
-
141
 |
 |
Private Equity
The private equity portfolio is comprised of equity and
mezzanine investments that vary by industry, stage and type
of investment. Private equity investments are reported at fair
value. Changes in the values of private equity investments are
reflected in our results of operations. Due to the nature of the
investments, the valuations incorporate assumptions as to
future performance, financial condition, liquidity, availability
of capital, and market conditions, among other factors, to
determine the estimated fair value of the investments. Market
conditions and actual performance of the investments could
differ from these assumptions. Accordingly, lower valuations
may occur that could adversely impact earnings in future
periods. Also, the valuations may not represent amounts that
will ultimately be realized from these investments. See Private
Equity Asset Valuation in the Critical Accounting Policies
And Judgments section of this Item 7 for additional
information.
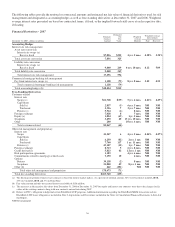
At December 31, 2007, private equity investments carried at
estimated fair value totaled $561 million compared with $463
million at December 31, 2006. As of December 31, 2007,
approximately 47% of the amount was invested directly in a
variety of companies and approximately 53% was invested in
various limited partnerships. Our unfunded commitments
related to private equity totaled $270 million at December 31,
2007 compared with $283 million at December 31, 2006.
Other Investments
We also make investments in affiliated and non-affiliated
funds with both traditional and alternative investment
strategies. The economic values could be driven by either the
fixed-income market or the equity markets, or both. At
December 31, 2007, other investments totaled $389 million
compared with $269 million at December 31, 2006. Our
unfunded commitments related to other investments totaled
$79 million at December 31, 2007 compared with $16 million
at December 31, 2006. The amounts of other investments and
related unfunded commitments at December 31, 2007
included those related to Steel City Capital Funding LLC as
further described in Note 24 Commitments and Guarantees in
the Notes To Consolidated Financial Statements in Item 8 of
this Report.
I
MPACT OF
I
NFLATION
Our assets and liabilities are primarily monetary in nature.
Accordingly, future changes in prices do not affect the
obligations to pay or receive fixed and determinable amounts
of money. During periods of inflation, monetary assets lose
value in terms of purchasing power and monetary liabilities
have corresponding purchasing power gains. The concept of
purchasing power, however, is not an adequate indicator of the
effect of inflation on banks because it does not take into
account changes in interest rates, which are an important
determinant of our earnings.
F
INANCIAL
D
ERIVATIVES
We use a variety of financial derivatives as part of the overall
asset and liability risk management process to help manage
interest rate, market and credit risk inherent in our business
activities. Substantially all such instruments are used to
manage risk related to changes in interest rates. Interest rate
and total return swaps, interest rate caps and floors and futures
contracts are the primary instruments we use for interest rate
risk management.
Financial derivatives involve, to varying degrees, interest rate,
market and credit risk. For interest rate swaps and total return
swaps, options and futures contracts, only periodic cash
payments and, with respect to options, premiums are
exchanged. Therefore, cash requirements and exposure to
credit risk are significantly less than the notional amount on
these instruments. Further information on our financial
derivatives is presented in Note 1 Accounting Policies and
Note 15 Financial Derivatives in the Notes To Consolidated
Financial Statements in Item 8 of this Report.
Not all elements of interest rate, market and credit risk are
addressed through the use of financial or other derivatives,
and such instruments may be ineffective for their intended
purposes due to unanticipated market characteristics, among
other reasons.
55