PNC Bank 2007 Annual Report Download - page 123
Download and view the complete annual report
Please find page 123 of the 2007 PNC Bank annual report below. You can navigate through the pages in the report by either clicking on the pages listed below, or by using the keyword search tool below to find specific information within the annual report.-
 1
1 -
2
-
3
-
4
-
5
-
6
-
7
-
8
-
9
-
10
-
11
-
12
-
13
-
14
-
15
-
16
-
17
-
18
-
19
-
20
-
21
-
22
-
23
-
24
-
25
-
26
-
27
-
28
-
29
-
30
-
31
-
32
-
33
-
34
-
35
-
36
-
37
-
38
-
39
-
40
-
41
-
42
-
43
-
44
-
45
-
46
-
47
-
48
-
49
-
50
-
51
-
52
-
53
-
54
-
55
-
56
-
57
-
58
-
59
-
60
-
61
-
62
-
63
-
64
-
65
-
66
-
67
-
68
-
69
-
70
-
71
-
72
-
73
-
74
-
75
-
76
-
77
-
78
-
79
-
80
-
81
-
82
-
83
-
84
-
85
-
86
-
87
-
88
-
89
-
90
-
91
-
92
-
93
-
94
-
95
-
96
-
97
-
98
-
99
-
100
-
101
-
102
-
103
-
104
-
105
-
106
-
107
-
108
-
109
-
110
-
111
-
112
-
 113
113 -
 114
114 -
 115
115 -
 116
116 -
 117
117 -
 118
118 -
 119
119 -
 120
120 -
 121
121 -
 122
122 -
 123
123 -
 124
124 -
 125
125 -
 126
126 -
 127
127 -
 128
128 -
 129
129 -
 130
130 -
 131
131 -
 132
132 -
 133
133 -
134
-
135
-
136
-
137
-
138
-
139
-
140
-
141
 |
 |

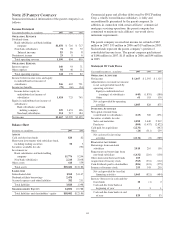
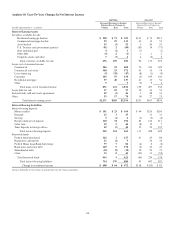
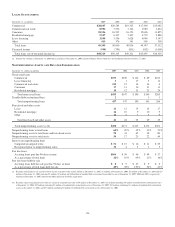
Analysis Of Year-To-Year Changes In Net Interest Income
2007/2006 2006/2005
Increase/(Decrease) in Income/
Expense Due to Changes in:
Increase/(Decrease) in Income/
Expense Due to Changes in:
Taxable-equivalent basis - in millions Volume Rate Total Volume Rate Total
Interest-Earning Assets
Securities available for sale
Residential mortgage-backed $ 228 $ 73 $ 301 $141 $ 74 $215
Commercial mortgage-backed 93 19 112 42 13 55
Asset-backed 55 (3) 52 32023
U.S. Treasury and government agencies (91) 2 (89) (85) 14 (71)
State and municipal 4 (1) 3 (1) (1)
Other debt (4) 2 (2) 112
Corporate stocks and other 7 (3) 4 4 (2) 2
Total securities available for sale 276 105 381 92 133 225
Loans, net of unearned income
Commercial 386 22 408 76 233 309
Commercial real estate 348 23 371 41 33 74
Lease financing (9) (38) (47) (8) (1) (9)
Consumer 103 55 158 (5) 109 104
Residential mortgage 97 40 137 41 13 54
Other 55(5) 9 4
Total loans, net of unearned income 871 161 1,032 129 407 536
Loans held for sale 17 10 27 19 34 53
Federal funds sold and resale agreements 49 (3) 46 52833
Other 53 17 70 (4) 27 23
Total interest-earning assets $1,271 $285 $1,556 $253 $617 $870
Interest-Bearing Liabilities
Interest-bearing deposits
Money market $ 141 $ 23 $ 164 $ 44 $216 $260
Demand 12 3 15 32 32
Savings 3 (1) 2 (3) (3) (6)
Retail certificates of deposit 120 74 194 85 126 211
Other time 39 5 44 (8) 15 7
Time deposits in foreign offices 49 (5) 44 52 53 105
Total interest-bearing deposits 349 114 463 111 498 609
Borrowed funds
Federal funds purchased 126 1 127 41 45 86
Repurchase agreements 11 (2) 9 36 36
Federal Home Loan Bank borrowings 77 7 84 (4) 2 (2)
Bank notes and senior debt 169 9 178 (2) 47 45
Subordinated debt (10) (8) (18) 19 53 72
Other 33 8 41 (90) 31 (59)
Total borrowed funds 416 5 421 (46) 224 178
Total interest-bearing liabilities 714 170 884 95 692 787
Change in net interest income $ 608 $ 64 $ 672 $138 $ (55) $ 83
Changes attributable to rate/volume are prorated into rate and volume components.
118