PNC Bank 2007 Annual Report Download - page 62
Download and view the complete annual report
Please find page 62 of the 2007 PNC Bank annual report below. You can navigate through the pages in the report by either clicking on the pages listed below, or by using the keyword search tool below to find specific information within the annual report.-
 1
1 -
2
-
3
-
4
-
5
-
6
-
7
-
8
-
9
-
10
-
11
-
12
-
13
-
14
-
15
-
16
-
17
-
18
-
19
-
20
-
21
-
22
-
23
-
24
-
25
-
26
-
27
-
28
-
29
-
30
-
31
-
32
-
33
-
34
-
35
-
36
-
37
-
38
-
39
-
40
-
41
-
42
-
43
-
44
-
45
-
46
-
47
-
48
-
49
-
50
-
51
-
 52
52 -
 53
53 -
 54
54 -
 55
55 -
 56
56 -
 57
57 -
 58
58 -
 59
59 -
 60
60 -
 61
61 -
 62
62 -
 63
63 -
 64
64 -
 65
65 -
 66
66 -
 67
67 -
 68
68 -
 69
69 -
 70
70 -
 71
71 -
 72
72 -
73
-
74
-
75
-
76
-
77
-
78
-
79
-
80
-
81
-
82
-
83
-
84
-
85
-
86
-
87
-
88
-
89
-
90
-
91
-
92
-
93
-
94
-
95
-
96
-
97
-
98
-
99
-
100
-
101
-
102
-
103
-
104
-
105
-
106
-
107
-
108
-
109
-
110
-
111
-
112
-
113
-
114
-
115
-
116
-
117
-
118
-
119
-
120
-
121
-
122
-
123
-
124
-
125
-
126
-
127
-
128
-
129
-
130
-
131
-
132
-
133
-
134
-
135
-
136
-
137
-
138
-
139
-
140
-
141
 |
 |
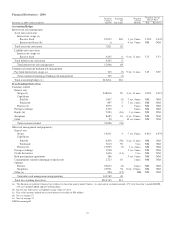
Financial Derivatives - 2006
December 31, 2006 - dollars in millions
Notional/
Contract
Amount
Estimated
Net
Fair Value
Weighted
Average
Maturity
Weighted-Average
Interest Rates
Paid Received
Accounting Hedges
Interest rate risk management
Asset rate conversion
Interest rate swaps (a)
Receive fixed $7,815 $62 3 yrs. 9 mos. 5.30% 5.43%
Interest rate floors (b) 6 4 yrs. 3 mos. NM NM
Total asset rate conversion 7,821 62
Liability rate conversion
Interest rate swaps (a)
Receive fixed 4,245 6 6 yrs. 11 mos. 5.15 5.43
Total liability rate conversion 4,245 6
Total interest rate risk management 12,066 68
Commercial mortgage banking risk management
Pay fixed interest rate swaps (a) 745 (7) 9 yrs. 11 mos. 5.25 5.09
Total commercial mortgage banking risk management 745 (7)
Total accounting hedges (c) $12,811 $61
Free-Standing Derivatives
Customer-related
Interest rate
Swaps (d) $48,816 $9 4 yrs. 11 mos. 5.00% 5.01%
Caps/floors
Sold (d) 1,967 (3) 7 yrs. 4 mos. NM NM
Purchased 897 3 7 yrs. 2 mos. NM NM
Futures (d) 2,973 2 9 mos. NM NM
Foreign exchange 5,245 6 mos. NM NM
Equity (d) 2,393 (63) 1 yr. 6 mos. NM NM
Swaptions 8,685 16 6 yrs. 10 mos. NM NM
Other 20 10 yrs. 6 mos. NM NM
Total customer-related 70,996 (36)
Other risk management and proprietary
Interest rate
Swaps 19,631 4 7 yrs. 8 mos. 4.81% 4.97%
Caps/floors
Sold (d) 6,500 (50) 2 yrs. 11 mos. NM NM
Purchased 7,010 59 3 yrs. NM NM
Futures (d) 13,955 (3) 1 yr. 4 mos. NM NM
Foreign exchange 1,958 5 yrs. 2 mos. NM NM
Credit derivatives 3,626 (11) 7 yrs. NM NM
Risk participation agreements 786 5 yrs. 5 mos. NM NM
Commitments related to mortgage-related assets 2,723 10 2 mos. NM NM
Options
Futures 63,033 (2) 8 mos. NM NM
Swaptions 25,951 54 6 yrs. 10 mos. NM NM
Other (e) 596 (12) NM NM NM
Total other risk management and proprietary 145,769 49
Total free-standing derivatives $216,765 $13
(a) The floating rate portion of interest rate contracts is based on money-market indices. As a percent of a notional amount, 67% were based on 1-month LIBOR,
27% on 3-month LIBOR and 6% on Prime Rate.
(b) Interest rate floors have a weighted-average strike of 3.21%.
(c) Fair value amounts include net accrued interest receivable of $94 million.
(d) See (c) on page 57.
(e) See (d) on page 57.
NM Not meaningful
57