PNC Bank 2007 Annual Report Download - page 121
Download and view the complete annual report
Please find page 121 of the 2007 PNC Bank annual report below. You can navigate through the pages in the report by either clicking on the pages listed below, or by using the keyword search tool below to find specific information within the annual report.-
 1
1 -
2
-
3
-
4
-
5
-
6
-
7
-
8
-
9
-
10
-
11
-
12
-
13
-
14
-
15
-
16
-
17
-
18
-
19
-
20
-
21
-
22
-
23
-
24
-
25
-
26
-
27
-
28
-
29
-
30
-
31
-
32
-
33
-
34
-
35
-
36
-
37
-
38
-
39
-
40
-
41
-
42
-
43
-
44
-
45
-
46
-
47
-
48
-
49
-
50
-
51
-
52
-
53
-
54
-
55
-
56
-
57
-
58
-
59
-
60
-
61
-
62
-
63
-
64
-
65
-
66
-
67
-
68
-
69
-
70
-
71
-
72
-
73
-
74
-
75
-
76
-
77
-
78
-
79
-
80
-
81
-
82
-
83
-
84
-
85
-
86
-
87
-
88
-
89
-
90
-
91
-
92
-
93
-
94
-
95
-
96
-
97
-
98
-
99
-
100
-
101
-
102
-
103
-
104
-
105
-
106
-
107
-
108
-
109
-
110
-
 111
111 -
 112
112 -
 113
113 -
 114
114 -
 115
115 -
 116
116 -
 117
117 -
 118
118 -
 119
119 -
 120
120 -
 121
121 -
 122
122 -
 123
123 -
 124
124 -
 125
125 -
 126
126 -
 127
127 -
 128
128 -
 129
129 -
 130
130 -
 131
131 -
132
-
133
-
134
-
135
-
136
-
137
-
138
-
139
-
140
-
141
 |
 |

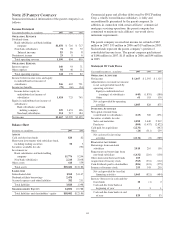
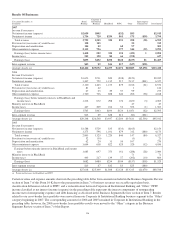
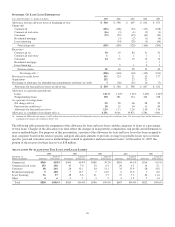
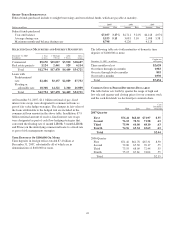
Results Of Businesses
Year ended December 31
In millions
Retail
Banking
Corporate &
Institutional
Banking BlackRock PFPC Other
Intercompany
Eliminations Consolidated
2007
I
NCOME
S
TATEMENT
Net interest income (expense) $2,059 $805 ($32) $83 $2,915
Noninterest income 1,736 720 $334 863 175 ($38) 3,790
Total revenue 3,795 1,525 334 831 258 (38) 6,705
Provision for (recoveries of) credit losses 138 125 52 315
Depreciation and amortization 124 22 60 97 303
Other noninterest expense 2,115 796 577 544 (39) 3,993
Earnings (loss) before income taxes 1,418 582 334 194 (435) 1 2,094
Income taxes 525 150 84 66 (198) 627
Earnings (loss) $893 $432 $250 $128 ($237) $1 $1,467
Inter-segment revenue $23 $9 $16 $17 ($27) ($38)
Average Assets (a) $42,424 $29,052 $4,259 $2,476 $48,885 ($3,678) $123,418
2006
I
NCOME
S
TATEMENT
Net interest income (expense) $1,673 $711 $20 ($38) ($121) $2,245
Noninterest income 1,447 752 1,135 917 2,137 ($61) 6,327
Total revenue 3,120 1,463 1,155 879 2,016 (61) 8,572
Provision for (recoveries of) credit losses 81 42 1 124
Depreciation and amortization 67 23 29 57 99 275
Other noninterest expense 1,760 726 828 646 266 (58) 4,168
Earnings (loss) before minority interests in BlackRock and
income taxes 1,212 672 298 176 1,650 (3) 4,005
Minority interests in BlackRock 47 47
Income taxes 447 209 104 52 552 (1) 1,363
Earnings (loss) $765 $463 $194 $124 $1,051 ($2) $2,595
Inter-segment revenue $13 $9 $28 $12 ($1) ($61)
Average Assets (a) $29,248 $26,548 $3,937 $2,204 $35,611 ($2,536) $95,012
2005
I
NCOME
S
TATEMENT
Net interest income (expense) $1,588 $729 $35 ($33) ($165) $2,154
Noninterest income 1,275 596 1,191 879 312 ($80) 4,173
Total revenue 2,863 1,325 1,226 846 147 (80) 6,327
Provision for (recoveries of) credit losses 52 (30) (1) 21
Depreciation and amortization 62 20 31 56 107 276
Other noninterest expense 1,664 638 822 629 329 (52) 4,030
Earnings before minority interests in BlackRock and income
taxes 1,085 697 373 161 (288) (28) 2,000
Minority interests in BlackRock 71 71
Income taxes 403 217 139 57 (202) (10) 604
Earnings (loss) $682 $480 $234 $104 ($157) ($18) $1,325
Inter-segment revenue $13 $7 $32 $3 $25 ($80)
Average Assets (a) $27,618 $25,309 $1,848 $2,128 $33,315 ($1,670) $88,548
(a) Period-end balances for BlackRock and PFPC
Certain revenue and expense amounts shown in the preceding table differ from amounts included in the Business Segments Review
section of Item 7 of this Form 10-K due to the presentation in Item 7 of business revenues on a taxable-equivalent basis,
classification differences related to PFPC, and a reclassification between Corporate & Institutional Banking and “Other.” PFPC
income classified as net interest income (expense) in the preceding table represents the interest components of nonoperating
income (net of nonoperating expense) and debt financing as disclosed in the Business Segments Review section of Item 7. Results
related to our cross-border lease portfolio were moved from our Corporate & Institutional Banking business segment to the “Other”
category beginning in 2007. The corresponding amounts for 2006 and 2005 remained in Corporate & Institutional Banking in the
preceding table; however, the 2006 cross-border lease portfolio results were moved to the “Other” category in the Business
Segments Review section of Item 7 of this Report.
116