PNC Bank 2007 Annual Report Download - page 40
Download and view the complete annual report
Please find page 40 of the 2007 PNC Bank annual report below. You can navigate through the pages in the report by either clicking on the pages listed below, or by using the keyword search tool below to find specific information within the annual report.-
 1
1 -
2
-
3
-
4
-
5
-
6
-
7
-
8
-
9
-
10
-
11
-
12
-
13
-
14
-
15
-
16
-
17
-
18
-
19
-
20
-
21
-
22
-
23
-
24
-
25
-
26
-
27
-
28
-
29
-
 30
30 -
 31
31 -
 32
32 -
 33
33 -
 34
34 -
 35
35 -
 36
36 -
 37
37 -
 38
38 -
 39
39 -
 40
40 -
 41
41 -
 42
42 -
 43
43 -
 44
44 -
 45
45 -
 46
46 -
 47
47 -
 48
48 -
 49
49 -
 50
50 -
51
-
52
-
53
-
54
-
55
-
56
-
57
-
58
-
59
-
60
-
61
-
62
-
63
-
64
-
65
-
66
-
67
-
68
-
69
-
70
-
71
-
72
-
73
-
74
-
75
-
76
-
77
-
78
-
79
-
80
-
81
-
82
-
83
-
84
-
85
-
86
-
87
-
88
-
89
-
90
-
91
-
92
-
93
-
94
-
95
-
96
-
97
-
98
-
99
-
100
-
101
-
102
-
103
-
104
-
105
-
106
-
107
-
108
-
109
-
110
-
111
-
112
-
113
-
114
-
115
-
116
-
117
-
118
-
119
-
120
-
121
-
122
-
123
-
124
-
125
-
126
-
127
-
128
-
129
-
130
-
131
-
132
-
133
-
134
-
135
-
136
-
137
-
138
-
139
-
140
-
141
 |
 |

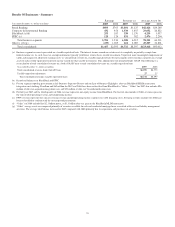
Results Of Businesses - Summary
Earnings Revenue (a) Average Assets (b)
Year ended December 31 - dollars in millions 2007 2006 2007 2006 2007 2006
Retail Banking $893 $765 $3,801 $3,125 $42,424 $29,248
Corporate & Institutional Banking 432 454 1,538 1,455 29,052 24,822
BlackRock (c)(d) 253 187 338 1,170 4,259 3,937
PFPC (e) 128 124 831 762 2,476 2,204
Total business segments 1,706 1,530 6,508 6,512 78,211 60,211
Other (c )(f) (g) (239) 1,065 224 2,085 45,207 34,801
Total consolidated $1,467 $2,595 $6,732 $8,597 $123,418 $95,012
(a) Business segment revenue is presented on a taxable-equivalent basis. The interest income earned on certain assets is completely or partially exempt from
federal income tax. As such, these tax-exempt instruments typically yield lower returns than a taxable investment. To provide more meaningful comparisons of
yields and margins for all interest-earning assets, we also provide revenue on a taxable-equivalent basis by increasing the interest income earned on tax-exempt
assets to make it fully equivalent to interest income earned on other taxable investments. This adjustment is not permitted under GAAP. The following is a
reconciliation of total consolidated revenue on a book (GAAP) basis to total consolidated revenue on a taxable-equivalent basis:
Year ended December 31 - dollars in millions 2007 2006
Total consolidated revenue, book (GAAP) basis $6,705 $8,572
Taxable-equivalent adjustment 27 25
Total consolidated revenue, taxable-equivalent basis $6,732 $8,597
(b) Period-end balances for BlackRock and PFPC.
(c) For our segment reporting presentation in this Business Segments Review and our Line of Business Highlights, after-tax BlackRock/MLIM transaction
integration costs totaling $3 million and $65 million for 2007 and 2006 have been reclassified from BlackRock to “Other.” “Other” for 2007 also includes $96
million of after-tax acquisition integration costs and $53 million of after-tax Visa indemnification costs.
(d) For full year 2007 and the fourth quarter of 2006, revenue represents our equity income from BlackRock. For the first nine months of 2006, revenue represents
the sum of total operating revenue and nonoperating income.
(e) PFPC revenue represents the sum of servicing revenue and nonoperating income (expense) less debt financing costs. Servicing revenue amounts for 2006 have
been reclassified to conform with the current period presentation.
(f) “Other” for 2006 included the $2.1 billion pretax, or $1.3 billion after-tax, gain on the BlackRock/MLIM transaction.
(g) “Other” average assets are comprised primarily of securities available for sale and residential mortgage loans associated with asset and liability management
activities. The average total balance increased in 2007 compared with 2006 primarily due to acquisitions and purchases of securities.
35