PNC Bank 2007 Annual Report Download - page 32
Download and view the complete annual report
Please find page 32 of the 2007 PNC Bank annual report below. You can navigate through the pages in the report by either clicking on the pages listed below, or by using the keyword search tool below to find specific information within the annual report.-
 1
1 -
2
-
3
-
4
-
5
-
6
-
7
-
8
-
9
-
10
-
11
-
12
-
13
-
14
-
15
-
16
-
17
-
18
-
19
-
20
-
21
-
 22
22 -
 23
23 -
 24
24 -
 25
25 -
 26
26 -
 27
27 -
 28
28 -
 29
29 -
 30
30 -
 31
31 -
 32
32 -
 33
33 -
 34
34 -
 35
35 -
 36
36 -
 37
37 -
 38
38 -
 39
39 -
 40
40 -
 41
41 -
 42
42 -
43
-
44
-
45
-
46
-
47
-
48
-
49
-
50
-
51
-
52
-
53
-
54
-
55
-
56
-
57
-
58
-
59
-
60
-
61
-
62
-
63
-
64
-
65
-
66
-
67
-
68
-
69
-
70
-
71
-
72
-
73
-
74
-
75
-
76
-
77
-
78
-
79
-
80
-
81
-
82
-
83
-
84
-
85
-
86
-
87
-
88
-
89
-
90
-
91
-
92
-
93
-
94
-
95
-
96
-
97
-
98
-
99
-
100
-
101
-
102
-
103
-
104
-
105
-
106
-
107
-
108
-
109
-
110
-
111
-
112
-
113
-
114
-
115
-
116
-
117
-
118
-
119
-
120
-
121
-
122
-
123
-
124
-
125
-
126
-
127
-
128
-
129
-
130
-
131
-
132
-
133
-
134
-
135
-
136
-
137
-
138
-
139
-
140
-
141
 |
 |
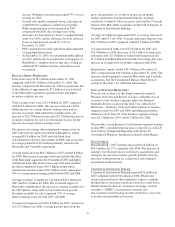
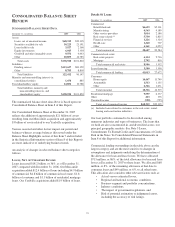
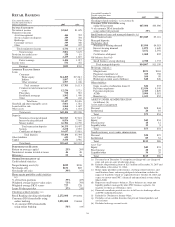
We estimate that at December 31, 2007 the effective duration
of securities available for sale was 2.8 years for an immediate
50 basis points parallel increase in interest rates and 2.5 years
for an immediate 50 basis points parallel decrease in interest
rates. Comparable amounts at December 31, 2006 were 2.6
years and 2.2 years, respectively.
L
OANS
H
ELD
F
OR
S
ALE
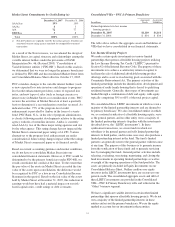
Loans held for sale totaled $3.9 billion at December 31, 2007
compared with $2.4 billion a year ago.
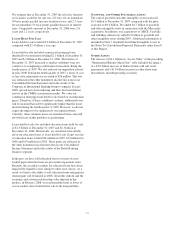
Loans held for sale included commercial mortgage loans
intended for securitization totaling $2.1 billion at December 31,
2007 and $.9 billion at December 31, 2006. The balance at
December 31, 2007 increased as market conditions were not
conducive to completing securitization transactions during the
fourth quarter of 2007. We also reduced our origination activity
in early 2008. During the fourth quarter of 2007, a lower of cost
or fair value adjustment was recorded of $26 million. This loss
was reflected in the other noninterest income line item in our
Consolidated Income Statement and in the results of the
Corporate & Institutional Banking business segment. In early
2008, spreads have been widening and there has been limited
activity in the CMBS securitization market. We value our
commercial mortgage loans held for sale based on securitization
prices. Therefore, if these conditions continue, additional losses
will be incurred that will be significantly higher than the losses
incurred during the fourth quarter of 2007. However, we do not
expect the impact to be significant to our capital position.
Currently, these valuation losses are unrealized (non-cash) and
all of the loans in this portfolio are performing.
Loans held for sale also included education loans held for sale
of $1.5 billion at December 31, 2007 and $1.3 billion at
December 31, 2006. Historically, we classified substantially
all of our education loans as loans held for sale. Gains on sales
of education loans totaled $24 million in 2007, $33 million for
2006 and $19 million for 2005. These gains are reflected in
the other noninterest income line item in our Consolidated
Income Statement and in the results of the Retail Banking
business segment.
In the past, we have sold education loans to issuers of asset-
backed paper when the loans are placed into repayment status.
Recently, the secondary markets for education loans have been
impacted by liquidity issues similar to other asset classes. As a
result, we believe the ability to sell education loans and generate
related gains will be limited in 2008. Given this outlook and the
economic and customer relationship value inherent in this
product, in February 2008, we transferred the loans at lower of
cost or market value from held for sale to the loan portfolio.
G
OODWILL AND
O
THER
I
NTANGIBLE
A
SSETS
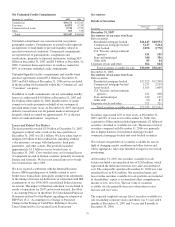
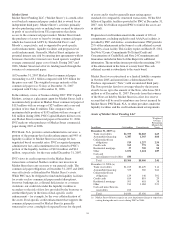
The sum of goodwill and other intangible assets increased
$5.5 billion at December 31, 2007 compared with the prior
year end, to $9.6 billion. We added $4.7 billion of goodwill
and other intangible assets in connection with the Mercantile
acquisition. In addition, our acquisitions of ARCS, Yardville
and Albridge collectively added $.9 billion of goodwill and
other intangible assets during 2007. Additional information is
included in Note 7 Goodwill And Other Intangible Assets in
the Notes To Consolidated Financial Statements under Item 8
of this Report.
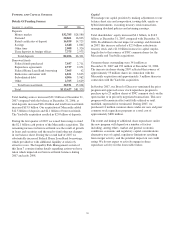
O
THER
A
SSETS
The increase of $4.1 billion in “Assets-Other” in the preceding
“Summarized Balance Sheet Data” table included the impact
of a $1.0 billion increase in Federal funds sold and resale
agreements and a $1.0 billion increase in other short-term
investments, including trading securities.
27