PNC Bank 2007 Annual Report Download - page 47
Download and view the complete annual report
Please find page 47 of the 2007 PNC Bank annual report below. You can navigate through the pages in the report by either clicking on the pages listed below, or by using the keyword search tool below to find specific information within the annual report.-
 1
1 -
2
-
3
-
4
-
5
-
6
-
7
-
8
-
9
-
10
-
11
-
12
-
13
-
14
-
15
-
16
-
17
-
18
-
19
-
20
-
21
-
22
-
23
-
24
-
25
-
26
-
27
-
28
-
29
-
30
-
31
-
32
-
33
-
34
-
35
-
36
-
 37
37 -
 38
38 -
 39
39 -
 40
40 -
 41
41 -
 42
42 -
 43
43 -
 44
44 -
 45
45 -
 46
46 -
 47
47 -
 48
48 -
 49
49 -
 50
50 -
 51
51 -
 52
52 -
 53
53 -
 54
54 -
 55
55 -
 56
56 -
 57
57 -
58
-
59
-
60
-
61
-
62
-
63
-
64
-
65
-
66
-
67
-
68
-
69
-
70
-
71
-
72
-
73
-
74
-
75
-
76
-
77
-
78
-
79
-
80
-
81
-
82
-
83
-
84
-
85
-
86
-
87
-
88
-
89
-
90
-
91
-
92
-
93
-
94
-
95
-
96
-
97
-
98
-
99
-
100
-
101
-
102
-
103
-
104
-
105
-
106
-
107
-
108
-
109
-
110
-
111
-
112
-
113
-
114
-
115
-
116
-
117
-
118
-
119
-
120
-
121
-
122
-
123
-
124
-
125
-
126
-
127
-
128
-
129
-
130
-
131
-
132
-
133
-
134
-
135
-
136
-
137
-
138
-
139
-
140
-
141
 |
 |

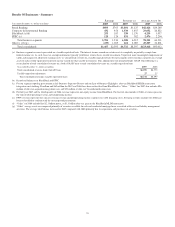
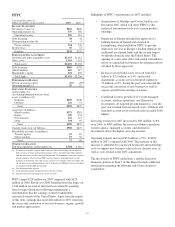
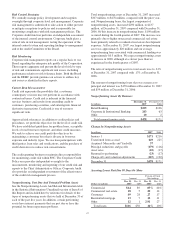
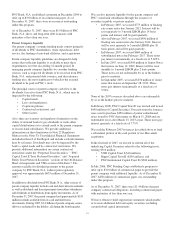
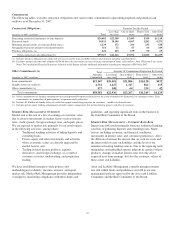
PFPC
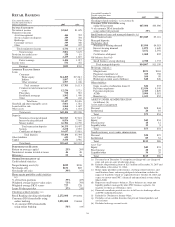
Year ended December 31
Dollars in millions except as noted 2007 2006
I
NCOME
S
TATEMENT
Servicing revenue (a) $863 $800
Operating expense (a) 637 586
Operating income 226 214
Debt financing 38 42
Nonoperating income (b) 64
Pretax earnings 194 176
Income taxes 66 52
Earnings $128 $124
P
ERIOD
-
END
B
ALANCE
S
HEET
Goodwill and other intangible assets $1,315 $1,012
Other assets 1,161 1,192
Total assets $2,476 $2,204
Debt financing $989 $792
Other liabilities 865 917
Shareholder’s equity 622 495
Total funds $2,476 $2,204
P
ERFORMANCE
R
ATIOS
Return on average equity 23% 29%
Operating margin (c) 26 27
S
ERVICING
S
TATISTICS
(at December 31)
Accounting/administration net fund
assets (in billions) (d)
Domestic $869 $746
Offshore 121 91
Total $990 $837
Asset type (in billions)
Money market $373 $281
Equity 390 354
Fixed income 123 117
Other 104 85
Total $990 $837
Custody fund assets (in billions) $500 $427
Shareholder accounts (in millions)
Transfer agency 19 18
Subaccounting 53 50
Total 72 68
O
THER INFORMATION
Full-time employees (at December 31) 4,784 4,381
(a) Certain out-of-pocket expense items which are then client billable are included in
both servicing revenue and operating expense above, but offset each other entirely
and therefore have no effect on operating income. Distribution revenue and expenses
which related to 12b-1 fees that PFPC receives from certain fund clients for the
payment of marketing, sales and service expenses also entirely offset each other, but
are netted for presentation purposes above. Amounts for 2006 have been reclassified
to conform with the 2007 presentation.
(b) Net of nonoperating expense.
(c) Total operating income divided by total servicing revenue.
(d) Includes alternative investment net assets serviced.
PFPC earned $128 million for 2007 compared with $124
million in 2006. Results for 2006 benefited from the impact of
a $14 million reversal of deferred taxes related to earnings
from foreign subsidiaries following management’s
determination that the earnings would be indefinitely
reinvested outside of the United States. Apart from the impact
of this item, earnings increased $18 million in 2007 reflecting
the successful conversion of net new business, organic growth
and market appreciation.
Highlights of PFPC’s performance in 2007 included:
• Acquisitions of Albridge and Coates Analytics in
December 2007 which will allow PFPC to add
analytical information tools to its current product
offerings.
• Expansion in Europe included the approval of a
banking license in Ireland and a branch in
Luxembourg, which will allow PFPC to provide
depositary services in Europe’s leading domicile for
traditional investment funds and the second largest
worldwide domicile after the United States. The
opening of a new sales office in London will enhance
efforts to expand global business development efforts
afforded by these approvals.
• Increases in total fund assets serviced from $2.2
trillion to $2.5 trillion, or 14%, and in total
shareholder accounts serviced from 68 million to
72 million, or 6%, during the past year reflected the
successful conversion of new business as well as
organic growth from existing customers.
• Combined revenue growth of 21% from managed
accounts, offshore operations, and alternative
investments, all targeted growth businesses, over the
past year resulted from increased assets. Offshore and
managed account assets serviced each exceeded $100
billion.
Servicing revenue for 2007 increased by $63 million, or 8%,
over 2006, to $863 million. Increases in offshore operations,
transfer agency, managed accounts, and alternative
investments drove the higher servicing revenue.
Operating expense increased $51 million, or 9%, to $637
million in 2007 compared with 2006. The majority of this
increase is attributable to increased headcount and technology
costs to support new business achieved over the past year, as
well as costs related to the 2007 acquisitions.
The discussions of PFPC under Item 1 and the Executive
Summary portion of Item 7 of this Report include additional
information regarding the Albridge and Coates Analytics
acquisitions.
42