PNC Bank 2007 Annual Report Download - page 52
Download and view the complete annual report
Please find page 52 of the 2007 PNC Bank annual report below. You can navigate through the pages in the report by either clicking on the pages listed below, or by using the keyword search tool below to find specific information within the annual report.-
 1
1 -
2
-
3
-
4
-
5
-
6
-
7
-
8
-
9
-
10
-
11
-
12
-
13
-
14
-
15
-
16
-
17
-
18
-
19
-
20
-
21
-
22
-
23
-
24
-
25
-
26
-
27
-
28
-
29
-
30
-
31
-
32
-
33
-
34
-
35
-
36
-
37
-
38
-
39
-
40
-
41
-
 42
42 -
 43
43 -
 44
44 -
 45
45 -
 46
46 -
 47
47 -
 48
48 -
 49
49 -
 50
50 -
 51
51 -
 52
52 -
 53
53 -
 54
54 -
 55
55 -
 56
56 -
 57
57 -
 58
58 -
 59
59 -
 60
60 -
 61
61 -
 62
62 -
63
-
64
-
65
-
66
-
67
-
68
-
69
-
70
-
71
-
72
-
73
-
74
-
75
-
76
-
77
-
78
-
79
-
80
-
81
-
82
-
83
-
84
-
85
-
86
-
87
-
88
-
89
-
90
-
91
-
92
-
93
-
94
-
95
-
96
-
97
-
98
-
99
-
100
-
101
-
102
-
103
-
104
-
105
-
106
-
107
-
108
-
109
-
110
-
111
-
112
-
113
-
114
-
115
-
116
-
117
-
118
-
119
-
120
-
121
-
122
-
123
-
124
-
125
-
126
-
127
-
128
-
129
-
130
-
131
-
132
-
133
-
134
-
135
-
136
-
137
-
138
-
139
-
140
-
141
 |
 |

Risk Control Strategies
We centrally manage policy development and exception
oversight through corporate-level risk management. Corporate
risk management is authorized to take action to either prevent
or mitigate exceptions to policies and is responsible for
monitoring compliance with risk management policies. The
Corporate Audit function performs an independent assessment
of the internal control environment. Corporate Audit plays a
critical role in risk management, testing the operation of the
internal control system and reporting findings to management
and to the Audit Committee of the Board.
Risk Monitoring
Corporate risk management reports on a regular basis to our
Board regarding the enterprise risk profile of the Corporation.
These reports aggregate and present the level of risk by type
of risk and communicate significant risk issues, including
performance relative to risk tolerance limits. Both the Board
and the ERMC provide guidance on actions to address key
risk issues as identified in these reports.
C
REDIT
R
ISK
M
ANAGEMENT
Credit risk represents the possibility that a customer,
counterparty or issuer may not perform in accordance with
contractual terms. Credit risk is inherent in the financial
services business and results from extending credit to
customers, purchasing securities, and entering into financial
derivative transactions. Credit risk is one of our most
significant risks.
Approved risk tolerances, in addition to credit policies and
procedures, set portfolio objectives for the level of credit risk.
We have established guidelines for problem loans, acceptable
levels of total borrower exposure, and other credit measures.
We seek to achieve our credit portfolio objectives by
maintaining a customer base that is diverse in borrower
exposure and industry types. We use loan participations with
third parties, loan sales and syndications, and the purchase of
credit derivatives to reduce risk concentrations.
The credit granting businesses maintain direct responsibility
for monitoring credit risk within PNC. The Corporate Credit
Policy area provides independent oversight to the
measurement, monitoring and reporting of our credit risk and
reports to the Chief Administrative Officer. Corporate Audit
also provides an independent assessment of the effectiveness
of the credit risk management process.
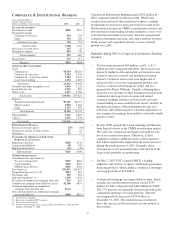
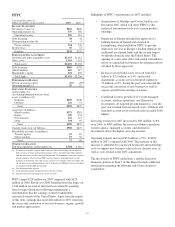
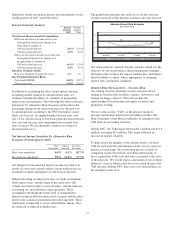
Nonperforming, Past Due And Potential Problem Assets
See the Nonperforming Assets And Related Information table
in the Statistical Information (Unaudited) section of Item 8 of
this Report and included here by reference for details of the
types of nonperforming assets that we held at December 31 of
each of the past five years. In addition, certain performing
assets have interest payments that are past due or have the
potential for future repayment problems.
Total nonperforming assets at December 31, 2007 increased
$307 million, to $478 million, compared with the prior year-
end. Nonperforming loans, the largest component of
nonperforming assets, increased $290 million, to $437
million, at December 31, 2007 compared with December 31,
2006. Of this increase in nonperforming loans, $190 million
occurred during the fourth quarter of 2007. The increase was
primarily due to higher nonaccrual commercial real estate
loans primarily related to residential real estate development
exposure. At December 31, 2007, our largest nonperforming
asset was approximately $20 million and our average
nonperforming loan associated with commercial lending was
approximately $0.5 million. We expect nonperforming assets
to increase in 2008, although at a slower pace than we
experienced in the fourth quarter of 2007.
The ratio of nonperforming assets to total assets rose to .34%
at December 31, 2007 compared with .17% at December 31,
2006.
The amount of nonperforming loans that was current as to
principal and interest was $178 million at December 31, 2007
and $59 million at December 31, 2006.
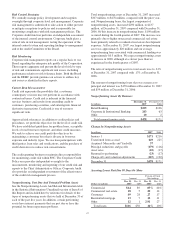
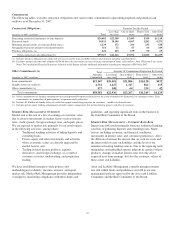
Nonperforming Assets By Business
In millions
December 31
2007
December 31
2006
Retail Banking $225 $106
Corporate & Institutional Banking 243 63
Other 10 2
Total nonperforming assets $478 $171
Change In Nonperforming Assets
In millions 2007 2006
January 1 $171 $216
Transferred from accrual 649 225
Acquired- Mercantile and Yardville 37
Principal reductions and payoffs (179) (116)
Asset sales (10) (17)
Returned to performing (23) (17)
Charge-offs and valuation adjustments (167) (120)
December 31 $478 $171
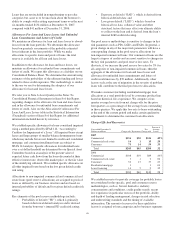
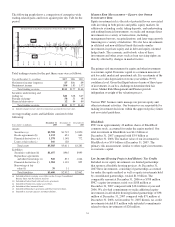
Accruing Loans Past Due 90 Days Or More
Amount
Percent of Total
Outstandings
Dollars in millions
Dec. 31
2007
Dec. 31
2006
Dec. 31
2007
Dec. 31
2006
Commercial $14 $9 .05% .04%
Commercial real estate 18 5.20 .14
Consumer 49 28 .27 .17
Residential mortgage 13 7.14 .11
Other 12 12.91 .27
Total loans $106 $50 .16% .10%
47