PNC Bank 2007 Annual Report Download - page 122
Download and view the complete annual report
Please find page 122 of the 2007 PNC Bank annual report below. You can navigate through the pages in the report by either clicking on the pages listed below, or by using the keyword search tool below to find specific information within the annual report.-
 1
1 -
2
-
3
-
4
-
5
-
6
-
7
-
8
-
9
-
10
-
11
-
12
-
13
-
14
-
15
-
16
-
17
-
18
-
19
-
20
-
21
-
22
-
23
-
24
-
25
-
26
-
27
-
28
-
29
-
30
-
31
-
32
-
33
-
34
-
35
-
36
-
37
-
38
-
39
-
40
-
41
-
42
-
43
-
44
-
45
-
46
-
47
-
48
-
49
-
50
-
51
-
52
-
53
-
54
-
55
-
56
-
57
-
58
-
59
-
60
-
61
-
62
-
63
-
64
-
65
-
66
-
67
-
68
-
69
-
70
-
71
-
72
-
73
-
74
-
75
-
76
-
77
-
78
-
79
-
80
-
81
-
82
-
83
-
84
-
85
-
86
-
87
-
88
-
89
-
90
-
91
-
92
-
93
-
94
-
95
-
96
-
97
-
98
-
99
-
100
-
101
-
102
-
103
-
104
-
105
-
106
-
107
-
108
-
109
-
110
-
111
-
 112
112 -
 113
113 -
 114
114 -
 115
115 -
 116
116 -
 117
117 -
 118
118 -
 119
119 -
 120
120 -
 121
121 -
 122
122 -
 123
123 -
 124
124 -
 125
125 -
 126
126 -
 127
127 -
 128
128 -
 129
129 -
 130
130 -
 131
131 -
 132
132 -
133
-
134
-
135
-
136
-
137
-
138
-
139
-
140
-
141
 |
 |

S
TATISTICAL
I
NFORMATION
(
UNAUDITED
)
T
HE
PNC F
INANCIAL
S
ERVICES
G
ROUP
,I
NC
.
S
ELECTED
Q
UARTERLY
F
INANCIAL
D
ATA
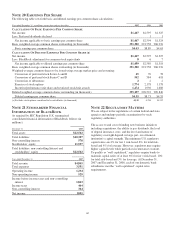
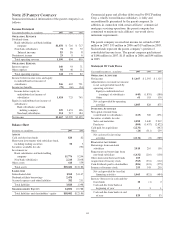
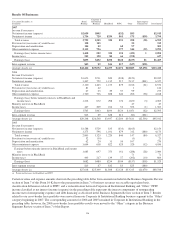
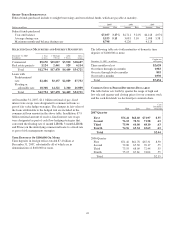
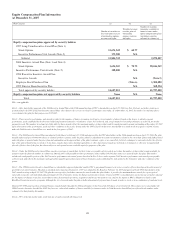
2007 2006
Dollars in millions,
except per share data Fourth Third Second First Fourth Third Second First
Summary Of Operations
Interest income $1,670 $1,627 $1,554 $1,315 $1,217 $1,203 $1,126 $1,066
Interest expense 877 866 816 692 651 636 570 510
Net interest income $ 793 $ 761 $ 738 $ 623 $ 566 $ 567 $ 556 $ 556
Provision for credit losses 188 65 54 8 42 16 44 22
Noninterest income (a) (b) 834 990 975 991 969 2,943 1,230 1,185
Noninterest expense (c) 1,213 1,099 1,040 944 969 1,167 1,145 1,162
Income before minority interest and income taxes $ 226 $ 587 $ 619 $ 662 $ 524 $2,327 $ 597 $ 557
Minority interest in income of BlackRock 61922
Income taxes 48 180 196 203 148 837 197 181
Net income (d) $ 178 $ 407 $ 423 $ 459 $ 376 $1,484 $ 381 $ 354
Per Common Share Data
Book value $43.60 $43.12 $42.36 $42.63 $36.80 $36.60 $29.92 $29.70
Basic earnings (d) (e) .53 1.21 1.24 1.49 1.29 5.09 1.30 1.21
Diluted earnings (d) (e) .52 1.19 1.22 1.46 1.27 5.01 1.28 1.19
(a) Noninterest income included equity management gains and net securities gains/(losses) in each quarter as follows (in millions):
2007 2006
Fourth Third Second First Fourth Third Second First
Equity management gains $21 $47 $2 $32 $25 $21 $54 $7
Net securities gains/(losses) $(1) $(2) $1 $(3) $(195) $(8) $(4)
(b) Noninterest income for the third quarter of 2006 included the pretax impact of the following: gain on the BlackRock/MLIM transaction of $2.1 billion; securities portfolio
rebalancing loss of $196 million; and mortgage loan portfolio repositioning loss of $48 million.
(c) Noninterest expense for the third quarter of 2006 included the pretax impact of BlackRock/MLIM transaction integration costs of $72 million.
(d) The net after-tax impact on third quarter 2006 net income of the items described in notes (d) and (e) above totaled $1.1 billion. The net impact of these items increased third
quarter 2006 basic earnings per share by $3.79 and increased diluted earnings per share by $3.73.
(e) The sum of quarterly amounts for 2007 and 2006 (diluted) does not equal the respective year’s amount because the quarterly calculations are based on a changing number of
average shares.
117