PNC Bank 2007 Annual Report Download - page 109
Download and view the complete annual report
Please find page 109 of the 2007 PNC Bank annual report below. You can navigate through the pages in the report by either clicking on the pages listed below, or by using the keyword search tool below to find specific information within the annual report.-
 1
1 -
2
-
3
-
4
-
5
-
6
-
7
-
8
-
9
-
10
-
11
-
12
-
13
-
14
-
15
-
16
-
17
-
18
-
19
-
20
-
21
-
22
-
23
-
24
-
25
-
26
-
27
-
28
-
29
-
30
-
31
-
32
-
33
-
34
-
35
-
36
-
37
-
38
-
39
-
40
-
41
-
42
-
43
-
44
-
45
-
46
-
47
-
48
-
49
-
50
-
51
-
52
-
53
-
54
-
55
-
56
-
57
-
58
-
59
-
60
-
61
-
62
-
63
-
64
-
65
-
66
-
67
-
68
-
69
-
70
-
71
-
72
-
73
-
74
-
75
-
76
-
77
-
78
-
79
-
80
-
81
-
82
-
83
-
84
-
85
-
86
-
87
-
88
-
89
-
90
-
91
-
92
-
93
-
94
-
95
-
96
-
97
-
98
-
 99
99 -
 100
100 -
 101
101 -
 102
102 -
 103
103 -
 104
104 -
 105
105 -
 106
106 -
 107
107 -
 108
108 -
 109
109 -
 110
110 -
 111
111 -
 112
112 -
 113
113 -
 114
114 -
 115
115 -
 116
116 -
 117
117 -
 118
118 -
 119
119 -
120
-
121
-
122
-
123
-
124
-
125
-
126
-
127
-
128
-
129
-
130
-
131
-
132
-
133
-
134
-
135
-
136
-
137
-
138
-
139
-
140
-
141
 |
 |

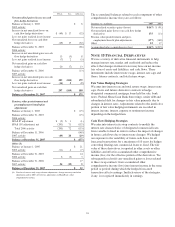
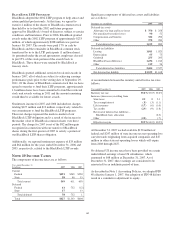
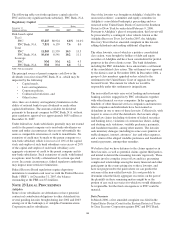
We used the following assumptions in the option pricing
model for purposes of estimating 2005 pro forma results as
well as to determine actual stock option expense:
• The risk-free interest rate is based on the US
Treasury yield curve,
• The dividend yield represents average yields over the
previous three-year period,
• Volatility is measured using the fluctuation in
month-end closing stock prices over a period which
corresponds with the average expected option life,
but in no case less than a five-year period, and
• The expected life assumption represents the period of
time that options granted are expected to be
outstanding and is based on a weighted average of
historical option activity.
Option Pricing Assumptions
Weighted-average for the year
ended December 31 2007 2006 2005
Risk-free interest rate 4.8% 4.5% 3.8%
Dividend yield 3.4 3.7 3.8
Volatility 18.8 20.5 25.7
Expected life 4.3 yrs. 5.1 yrs. 4.8 yrs.
I
NCENTIVE
/P
ERFORMANCE
U
NIT
S
HARE
A
WARDS AND
R
ESTRICTED
S
TOCK
/U
NIT
A
WARDS
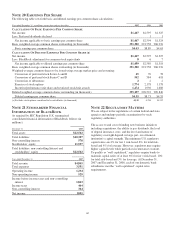
The fair value of nonvested incentive/performance unit share
awards and restricted stock/unit awards is initially determined
based on prices not less than the market value of our common
stock price on the date of grant. Incentive/performance unit
share awards are subsequently valued subject to the
achievement of one or more financial and other performance
goals over a three-year period. The Personnel and
Compensation Committee of the Board of Directors approves
the final award payout with respect to incentive/performance
unit share awards. Restricted stock/unit awards have various
vesting periods ranging from 24 months to 60 months. There
are no financial or performance goals associated with any of
our restricted stock/unit awards.
The weighted-average grant-date fair value of incentive/
performance unit share awards and restricted stock/unit
awards granted in 2007, 2006 and 2005 was $73.83, $67.36
and $53.81 per share, respectively. We recognize
compensation expense for such awards ratably over the
corresponding vesting and/or performance periods for each
type of program. Total compensation expense recognized
related to PNC incentive/performance unit share awards and
restricted stock/unit awards during 2007 was approximately
$42 million compared with $45 million in 2006 and $44
million in 2005.
A summary of nonvested incentive/performance unit shares
and restricted stock award activity follows:
Shares in thousands
Nonvested
Incentive/
Performance
Unit Shares
Weighted-
Average
Grant
Date Fair
Value
Nonvested
Restricted
Stock/
Unit
Shares
Weighted-
Average
Grant
Date Fair
Value
Dec. 31, 2006 186 $64.15 2,425 $57.45
Granted 138 69.08 617 69.86
Vested (1,082) 59.54
Forfeited (8) 64.31 (91) 60.25
Dec. 31, 2007 316 $66.31 1,869 $60.20
In the chart above, the weighted-average grant-date fair value
of incentive/performance unit share awards and restricted
stock/unit awards is measured by reducing the grant date price
by the present value of dividends expected to be paid on the
underlying shares and for estimated forfeitures on restricted
stock/unit awards.
At December 31, 2007, there was $45 million of unrecognized
deferred compensation expense related to nonvested share-
based compensation arrangements granted under the Incentive
Plans. This cost is expected to be recognized as expense over a
period of no longer than five years. The total fair value of
incentive/performance unit share and restricted stock /unit
awards vested during 2007, 2006 and 2005 was approximately
$79 million, $63 million and $3 million, respectively.
Additionally, in 2007 and 2006 we granted a performance unit
incentive award in each year to a senior executive. The grant
is share-denominated with an initial specified target number of
26,400 share units for 2007 and 30,000 share units for 2006.
The potential award is dependent on the achievement of
certain performance criteria over a three-year period ending
December 31, 2008 for the 2006 grant and December 31, 2009
for the 2007 grant. Final awarded performance units will be
paid only in cash. Total compensation expense recognized
related to these incentive awards during 2007 and 2006 was
approximately $1 million in each year.
E
MPLOYEE
S
TOCK
P
URCHASE
P
LAN
Our ESPP has approximately 1.3 million shares available for
issuance. Full-time employees with six months and part-time
employees with 12 months of continuous employment with us
are eligible to participate in the ESPP at the commencement of
the next six-month offering period. Eligible participants may
purchase our common stock at 95% of the fair market value
on the last day of each six-month offering period. No charge
to earnings is recorded with respect to the ESPP.
Shares issued pursuant to the ESPP were as follows:
Year ended December 31 Shares Price Per Share
2007 111,812 $68.00 and $62.37
2006 105,041 66.66 and 70.34
2005 138,754 51.74 and 58.74
104