PNC Bank 2007 Annual Report Download - page 27
Download and view the complete annual report
Please find page 27 of the 2007 PNC Bank annual report below. You can navigate through the pages in the report by either clicking on the pages listed below, or by using the keyword search tool below to find specific information within the annual report.-
 1
1 -
2
-
3
-
4
-
5
-
6
-
7
-
8
-
9
-
10
-
11
-
12
-
13
-
14
-
15
-
16
-
 17
17 -
 18
18 -
 19
19 -
 20
20 -
 21
21 -
 22
22 -
 23
23 -
 24
24 -
 25
25 -
 26
26 -
 27
27 -
 28
28 -
 29
29 -
 30
30 -
 31
31 -
 32
32 -
 33
33 -
 34
34 -
 35
35 -
 36
36 -
 37
37 -
38
-
39
-
40
-
41
-
42
-
43
-
44
-
45
-
46
-
47
-
48
-
49
-
50
-
51
-
52
-
53
-
54
-
55
-
56
-
57
-
58
-
59
-
60
-
61
-
62
-
63
-
64
-
65
-
66
-
67
-
68
-
69
-
70
-
71
-
72
-
73
-
74
-
75
-
76
-
77
-
78
-
79
-
80
-
81
-
82
-
83
-
84
-
85
-
86
-
87
-
88
-
89
-
90
-
91
-
92
-
93
-
94
-
95
-
96
-
97
-
98
-
99
-
100
-
101
-
102
-
103
-
104
-
105
-
106
-
107
-
108
-
109
-
110
-
111
-
112
-
113
-
114
-
115
-
116
-
117
-
118
-
119
-
120
-
121
-
122
-
123
-
124
-
125
-
126
-
127
-
128
-
129
-
130
-
131
-
132
-
133
-
134
-
135
-
136
-
137
-
138
-
139
-
140
-
141
 |
 |

C
ONSOLIDATED
I
NCOME
S
TATEMENT
R
EVIEW
N
ET
I
NTEREST
I
NCOME
-O
VERVIEW
Changes in net interest income and margin result from the
interaction of the volume and composition of interest-earning
assets and related yields, interest-bearing liabilities and related
rates paid, and noninterest-bearing sources of funding.
See Statistical Information – Analysis of Year-To-Year
Changes In Net Interest Income and Average Consolidated
Balance Sheet and Net Interest Analysis in Item 8 of this
Report for additional information.
N
ET
I
NTEREST
I
NCOME
- GAAP R
ECONCILIATION
The interest income earned on certain assets is completely or
partially exempt from federal income tax. As such, these
tax-exempt instruments typically yield lower returns than a
taxable investment. To provide more meaningful comparisons
of yields and margins for all interest-earning assets, we also
provide net interest income on a taxable-equivalent basis by
increasing the interest income earned on tax-exempt assets to
make it fully equivalent to interest income earned on other
taxable investments. This adjustment is not permitted under
GAAP in the Consolidated Income Statement.
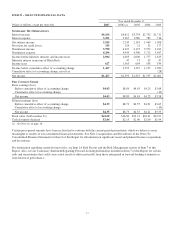
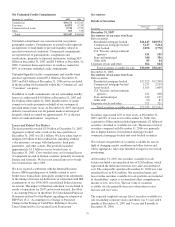
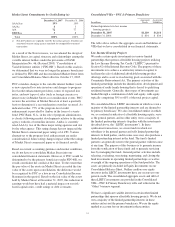
A reconciliation of net interest income as reported in the
Consolidated Income Statement (GAAP basis) to net interest
income on a taxable-equivalent basis follows (in millions):
For the year ended December 31,
2007 2006 2005
Net interest income, GAAP basis $2,915 $2,245 $2,154
Taxable-equivalent adjustment 27 25 33
Net interest income, taxable-
equivalent basis $2,942 $2,270 $2,187
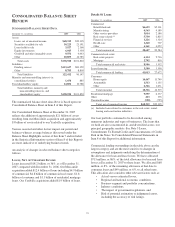
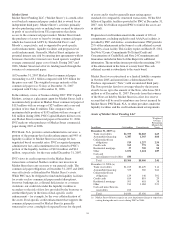
Taxable-equivalent net interest income increased $672
million, or 30%, in 2007 compared with 2006. This increase
was consistent with the $20.3 billion, or 26%, increase in
average interest-earning assets during 2007 compared with
2006. The reasons driving the higher interest-earning assets in
2007 are further discussed in the Balance Sheet Highlights
portion of the Executive Summary section of this Item 7.
We expect net interest income to be higher in 2008 compared
with 2007, assuming our current expectations for interest rates
and economic conditions. Our forward-looking statements are
based on our current expectations that interest rates will
remain low through most of 2008 and that economic
conditions, although showing slower growth than in recent
years, will avoid a recession.
N
ET
I
NTEREST
M
ARGIN
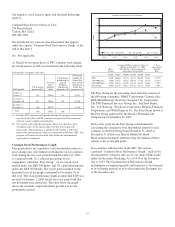
The net interest margin was 3.00% for 2007 and 2.92% for
2006. The following factors impacted the comparison:
• The Mercantile acquisition.
• The yield on interest-earning assets increased 35
basis points. The yield on loans, the single largest
component, increased 31 basis points.
• These factors were partially offset by an increase in
the rate paid on interest-bearing liabilities of 25 basis
points. The rate paid on interest-bearing deposits, the
single largest component, increased 22 basis points.
• The impact of noninterest-bearing sources of funding
decreased 2 basis points in 2007 compared with the
prior year.
Comparing yields and rates paid to the broader market, the
average federal funds rate was 5.03% during 2007 compared
with 4.96% for 2006.
We believe that net interest margins for our industry will
continue to be impacted by competition for high quality loans
and deposits and customer migration from lower to higher rate
deposit or other products. We expect our net interest margin to
improve slightly in 2008 compared with 2007, assuming our
current expectations for interest rates and economic conditions.
P
ROVISION
F
OR
C
REDIT
L
OSSES
The provision for credit losses totaled $315 million for 2007
and $124 million for 2006. Of the total 2007 provision, $188
million was recorded in the fourth quarter, including
approximately $45 million related to our Yardville acquisition.
The higher provision in 2007 was also impacted by an increase
in our real estate portfolio, including residential real estate
development exposure, and growth in total credit exposure.
Total residential real estate development outstandings were
approximately $2.1 billion at December 31, 2007.
We do not expect to sustain asset quality at its current level.
Given our projections for loan growth and continued credit
deterioration, we expect nonperforming assets and the
provision for credit losses will be higher in 2008 compared
with 2007. Also, we expect that the level of provision for
credit losses in the first quarter of 2008 will be modestly lower
than the amount reported for the fourth quarter of 2007.
The Credit Risk Management portion of the Risk Management
section of this Item 7 includes additional information
regarding factors impacting the provision for credit losses.
N
ONINTEREST
I
NCOME
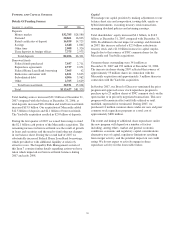
Summary
Noninterest income was $3.790 billion for 2007 and $6.327
billion for 2006. Noninterest income for 2007 included the
impact of $83 million gain recognized in connection with our
transfer of BlackRock shares to satisfy a portion of PNC’s
LTIP obligation and a $210 million net loss representing the
mark-to-market adjustment on our LTIP obligation.
22