PNC Bank 2007 Annual Report Download - page 108
Download and view the complete annual report
Please find page 108 of the 2007 PNC Bank annual report below. You can navigate through the pages in the report by either clicking on the pages listed below, or by using the keyword search tool below to find specific information within the annual report.-
 1
1 -
2
-
3
-
4
-
5
-
6
-
7
-
8
-
9
-
10
-
11
-
12
-
13
-
14
-
15
-
16
-
17
-
18
-
19
-
20
-
21
-
22
-
23
-
24
-
25
-
26
-
27
-
28
-
29
-
30
-
31
-
32
-
33
-
34
-
35
-
36
-
37
-
38
-
39
-
40
-
41
-
42
-
43
-
44
-
45
-
46
-
47
-
48
-
49
-
50
-
51
-
52
-
53
-
54
-
55
-
56
-
57
-
58
-
59
-
60
-
61
-
62
-
63
-
64
-
65
-
66
-
67
-
68
-
69
-
70
-
71
-
72
-
73
-
74
-
75
-
76
-
77
-
78
-
79
-
80
-
81
-
82
-
83
-
84
-
85
-
86
-
87
-
88
-
89
-
90
-
91
-
92
-
93
-
94
-
95
-
96
-
97
-
 98
98 -
 99
99 -
 100
100 -
 101
101 -
 102
102 -
 103
103 -
 104
104 -
 105
105 -
 106
106 -
 107
107 -
 108
108 -
 109
109 -
 110
110 -
 111
111 -
 112
112 -
 113
113 -
 114
114 -
 115
115 -
 116
116 -
 117
117 -
 118
118 -
119
-
120
-
121
-
122
-
123
-
124
-
125
-
126
-
127
-
128
-
129
-
130
-
131
-
132
-
133
-
134
-
135
-
136
-
137
-
138
-
139
-
140
-
141
 |
 |

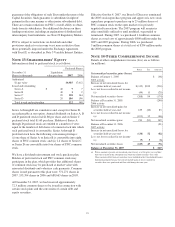
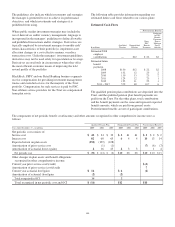
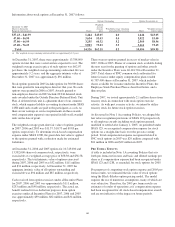
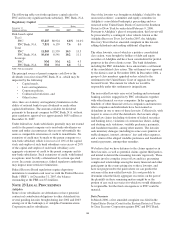
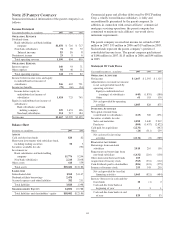
Information about stock options at December 31, 2007 follows:
Options Outstanding Options Exercisable (a)
December 31, 2007
Shares in thousands
Range of exercise prices Shares
Weighted-
average
exercise
price
Weighted-average remaining
contractual life (in years) Shares
Weighted-average
exercise price
$37.43 – $46.99 1,444 $43.05 4.0 1,444 $43.05
47.00 – 56.99 3,634 53.43 5.4 3,022 53.40
57.00 – 66.99 3,255 60.32 5.2 2,569 58.96
67.00 – 76.23 5,993 73.03 5.5 3,461 73.45
Total 14,326 $62.15 5.3 10,496 $59.95
(a) The weighted-average remaining contractual life was approximately 4.2 years.
At December 31, 2007, there were approximately 13,788,000
options in total that were vested and are expected to vest. The
weighted-average exercise price of such options was $62.07
per share, the weighted-average remaining contractual life was
approximately 5.2 years, and the aggregate intrinsic value at
December 31, 2007 was approximately $92 million.
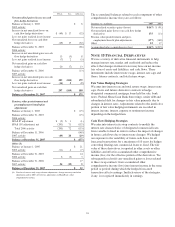
Stock options granted in 2005 include options for 30,000 shares
that were granted to non-employee directors that year. No such
options were granted in 2006 or 2007. Awards granted to
non-employee directors in 2007 include 20,944 deferred stock
units awarded under the Outside Directors Deferred Stock Unit
Plan. A deferred stock unit is a phantom share of our common
stock, which requires liability accounting treatment under SFAS
123R until such awards are paid to the participants as cash. As
there are no vestings or service requirements on these awards,
total compensation expense is recognized in full on all awarded
units on the date of grant.
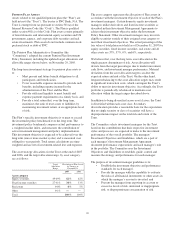
The weighted-average grant-date fair value of options granted
in 2007, 2006 and 2005 was $11.37, $10.75 and $9.83 per
option, respectively. To determine stock-based compensation
expense under SFAS 123R, the grant-date fair value is applied
to the options granted with a reduction made for estimated
forfeitures.
At December 31, 2006 and 2005 options for 10,743,000 and
13,582,000 shares of common stock, respectively, were
exercisable at a weighted-average price of $58.38 and $56.58,
respectively. The total intrinsic value of options exercised
during 2007, 2006 and 2005 was $52 million, $111 million
and $31 million, respectively. At December 31, 2007 the
aggregate intrinsic value of all options outstanding and
exercisable was $94 million and $87 million, respectively.
Cash received from option exercises under all Incentive Plans
for 2007, 2006 and 2005 was approximately $111 million,
$233 million and $98 million, respectively. The actual tax
benefit realized for tax deduction purposes from option
exercises under all Incentive Plans for 2007, 2006 and 2005
was approximately $39 million, $82 million and $34 million,
respectively.
There were no options granted in excess of market value in
2007, 2006 or 2005. Shares of common stock available during
the next year for the granting of options and other awards
under the Incentive Plans were 40,116,726 at December 31,
2007. Total shares of PNC common stock authorized for
future issuance under equity compensation plans totaled
41,787,400 shares at December 31, 2007, which includes
shares available for issuance under the Incentive Plans, the
Employee Stock Purchase Plan as described below, and a
director plan.
During 2007, we issued approximately 2.1 million shares from
treasury stock in connection with stock option exercise
activity. As with past exercise activity, we intend to utilize
treasury stock for future stock option exercises.
As discussed in Note 1 Accounting Policies, we adopted the
fair value recognition provisions of SFAS 123 prospectively
to all employee awards including stock options granted,
modified or settled after January 1, 2003. As permitted under
SFAS 123, we recognized compensation expense for stock
options on a straight-line basis over the pro rata vesting
period. Total compensation expense recognized related to
PNC stock options in 2007 was $29 million compared with
$31 million in 2006 and $29 million in 2005.
P
RO
F
ORMA
E
FFECTS
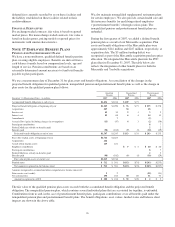
A table is included in Note 1 Accounting Policies that sets
forth pro forma net income and basic and diluted earnings per
share as if compensation expense had been recognized under
SFAS 123 and 123R, as amended, for stock options for 2005.
For purposes of computing stock option expense and 2005 pro
forma results, we estimated the fair value of stock options
using the Black-Scholes option pricing model. The model
requires the use of numerous assumptions, many of which are
very subjective. Therefore, the 2005 pro forma results are
estimates of results of operations as if compensation expense
had been recognized for all stock-based compensation awards
and are not indicative of the impact on future periods.
103