PNC Bank 2007 Annual Report Download - page 28
Download and view the complete annual report
Please find page 28 of the 2007 PNC Bank annual report below. You can navigate through the pages in the report by either clicking on the pages listed below, or by using the keyword search tool below to find specific information within the annual report.-
 1
1 -
2
-
3
-
4
-
5
-
6
-
7
-
8
-
9
-
10
-
11
-
12
-
13
-
14
-
15
-
16
-
17
-
 18
18 -
 19
19 -
 20
20 -
 21
21 -
 22
22 -
 23
23 -
 24
24 -
 25
25 -
 26
26 -
 27
27 -
 28
28 -
 29
29 -
 30
30 -
 31
31 -
 32
32 -
 33
33 -
 34
34 -
 35
35 -
 36
36 -
 37
37 -
 38
38 -
39
-
40
-
41
-
42
-
43
-
44
-
45
-
46
-
47
-
48
-
49
-
50
-
51
-
52
-
53
-
54
-
55
-
56
-
57
-
58
-
59
-
60
-
61
-
62
-
63
-
64
-
65
-
66
-
67
-
68
-
69
-
70
-
71
-
72
-
73
-
74
-
75
-
76
-
77
-
78
-
79
-
80
-
81
-
82
-
83
-
84
-
85
-
86
-
87
-
88
-
89
-
90
-
91
-
92
-
93
-
94
-
95
-
96
-
97
-
98
-
99
-
100
-
101
-
102
-
103
-
104
-
105
-
106
-
107
-
108
-
109
-
110
-
111
-
112
-
113
-
114
-
115
-
116
-
117
-
118
-
119
-
120
-
121
-
122
-
123
-
124
-
125
-
126
-
127
-
128
-
129
-
130
-
131
-
132
-
133
-
134
-
135
-
136
-
137
-
138
-
139
-
140
-
141
 |
 |

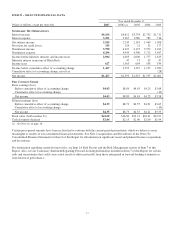
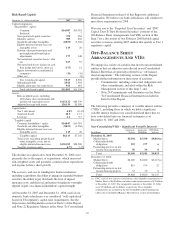
Noninterest income for 2006 included the impact of the
following items:
• The gain on the BlackRock/MLIM transaction, which
totaled $2.078 billion,
• The effects of our third quarter 2006 balance sheet
repositioning activities that resulted in charges
totaling $244 million, and
• PNC consolidated BlackRock in its results for the
first nine months of 2006 but accounted for
BlackRock on the equity method for the fourth
quarter of 2006 and all of 2007. Had our BlackRock
investment been on the equity method for all of 2006,
BlackRock’s noninterest income reported by us
would have been lower by $943 million for that year.
Apart from the impact of these items, noninterest income
increased $367 million, or 10%, in 2007 compared with 2006
largely as a result of the Mercantile acquisition and growth in
several fee income categories.
We expect that net interest income and noninterest income
will increase in 2008 compared with 2007. We also believe
that PNC will create positive operating leverage in 2008 with
a percentage growth in total revenue relative to 2007 that will
exceed the percentage growth in noninterest expense from
2007.
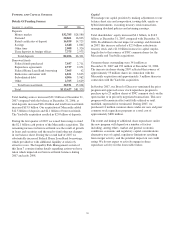
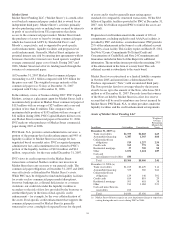
Additional analysis
Asset management fees totaled $784 million for 2007 and
$1.420 billion for 2006. Our equity income from BlackRock
has been included in asset management fees beginning with
the fourth quarter of 2006. Asset management fees were
higher in 2006 as the first nine months of 2006 reflected the
impact of BlackRock’s revenue on a consolidated basis.
Assets managed at December 31, 2007 totaled $73 billion
compared with $54 billion at December 31, 2006. This
increase resulted primarily from the Mercantile acquisition.
We refer you to the Retail Banking section of the Business
Segments Review section of this Item 7 for further discussion
of assets under management.
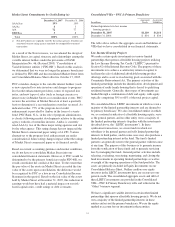
Fund servicing fees declined $58 million in 2007, to $835
million, compared with $893 million in the prior year.
Amounts for 2006 included $117 million of distribution fee
revenue at PFPC. Effective January 1, 2007, we refined our
accounting and reporting of PFPC’s distribution fee revenue
and related expense amounts and present these amounts net on
a prospective basis. Prior to 2007, the distribution amounts
were shown on a gross basis within fund servicing fees and
within other noninterest expense and offset each other entirely
with no impact on earnings.
Apart from the impact of the distribution fee revenue included
in the 2006 amounts, fund servicing fees increased $59
million in 2007 compared with the prior year. Higher revenue
from offshore operations, transfer agency, managed accounts
and alternative investments contributed to the increase in
2007, reflecting net new business and growth from existing
clients. The PFPC section of the Business Segments Review
section of this Item 7 includes information on net fund assets
and custody fund assets serviced.
Service charges on deposits increased $35 million, or 11%, to
$348 million for 2007 compared with 2006. The increase was
primarily due to the impact of Mercantile.
Brokerage fees increased $32 million, or 13%, to $278 million
for 2007 compared with the prior year. The increase was
primarily due to higher mutual fund-related revenues,
continued growth in our fee-based fund advisory business and
higher annuity income.
Consumer services fees increased $49 million, or 13%, to
$414 million in 2007 compared with 2006. The increase
reflected the impact of Mercantile, higher debit card revenues
resulting from higher transaction volumes, and fees from the
credit card business that began in the latter part of 2006.
Corporate services revenue was $713 million for 2007, an
increase of $87 million, or 14%, over 2006. Higher revenue from
commercial mortgage servicing including the impact of the
ARCS acquisition, treasury management, third party consumer
loan servicing activities and the Mercantile acquisition
contributed to the increase in 2007 over the prior year.
Equity management (private equity) net gains on portfolio
investments totaled $102 million in 2007 and $107 million in
2006. Based on the nature of private equity activities, net
gains or losses may fluctuate from period to period.
Net securities losses totaled $5 million in 2007 and $207
million in 2006. We took actions during the third quarter of
2006 that resulted in the sale of approximately $6 billion of
securities available for sale at an aggregate pretax loss of $196
million during that quarter.
Noninterest revenue from trading activities totaled $104 million
in 2007 compared with $183 million in 2006. While customer
trading income increased in comparison, total trading revenue
declined in 2007 largely due to the lower economic hedging
gains associated with commercial mortgage loan activity and
economic hedging losses associated with structured resale
agreements. We provide additional information on our trading
activities under Market Risk Management – Trading Risk in the
Risk Management section of this Item 7.
Net losses related to our BlackRock investment amounted to
$127 million in 2007, representing the net of the
mark-to-market adjustment on our LTIP obligation and gain
recognized in connection with our transfer of shares to satisfy
a portion of our LTIP obligation, compared with a net gain of
$2.066 billion in 2006. The 2006 amount included the $2.078
billion gain on the BlackRock/MLIM transaction. See the
BlackRock portion of the Business Segments Review section
of Item 7 of this Report for further information.
23