PNC Bank 2007 Annual Report Download - page 59
Download and view the complete annual report
Please find page 59 of the 2007 PNC Bank annual report below. You can navigate through the pages in the report by either clicking on the pages listed below, or by using the keyword search tool below to find specific information within the annual report.-
 1
1 -
2
-
3
-
4
-
5
-
6
-
7
-
8
-
9
-
10
-
11
-
12
-
13
-
14
-
15
-
16
-
17
-
18
-
19
-
20
-
21
-
22
-
23
-
24
-
25
-
26
-
27
-
28
-
29
-
30
-
31
-
32
-
33
-
34
-
35
-
36
-
37
-
38
-
39
-
40
-
41
-
42
-
43
-
44
-
45
-
46
-
47
-
48
-
 49
49 -
 50
50 -
 51
51 -
 52
52 -
 53
53 -
 54
54 -
 55
55 -
 56
56 -
 57
57 -
 58
58 -
 59
59 -
 60
60 -
 61
61 -
 62
62 -
 63
63 -
 64
64 -
 65
65 -
 66
66 -
 67
67 -
 68
68 -
 69
69 -
70
-
71
-
72
-
73
-
74
-
75
-
76
-
77
-
78
-
79
-
80
-
81
-
82
-
83
-
84
-
85
-
86
-
87
-
88
-
89
-
90
-
91
-
92
-
93
-
94
-
95
-
96
-
97
-
98
-
99
-
100
-
101
-
102
-
103
-
104
-
105
-
106
-
107
-
108
-
109
-
110
-
111
-
112
-
113
-
114
-
115
-
116
-
117
-
118
-
119
-
120
-
121
-
122
-
123
-
124
-
125
-
126
-
127
-
128
-
129
-
130
-
131
-
132
-
133
-
134
-
135
-
136
-
137
-
138
-
139
-
140
-
141
 |
 |
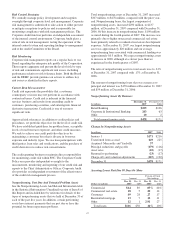
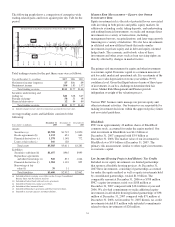
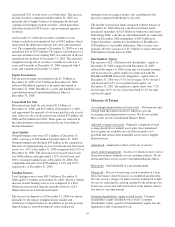
The following graph shows a comparison of enterprise-wide
trading-related gains and losses against prior day VaR for the
period.
Enterprise-Wide Trading-Related Gains/Losses Versus Value at Risk YTD 2007
(15)
(10)
(5)
0
5
10
15
12/31/06
1/31/07
2/28/07
3/31/07
4/30/07
5/31/07
6/30/07
7/31/07
8/31/07
9/30/07
10/31/07
11/30/07
12/31/07
Millions
VaR
P&L
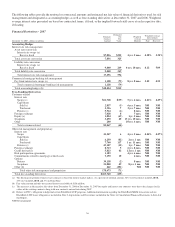
Total trading revenue for the past three years was as follows:
Year end December 31 - in millions 2007 2006 2005
Net interest income (expense) $7 $(6) $9
Noninterest income 104 183 157
Total trading revenue $111 $177 $166
Securities underwriting and
trading (a) $41 $38 $47
Foreign exchange 58 55 39
Financial derivatives 12 84 80
Total trading revenue $111 $177 $166
(a) Includes changes in fair value for certain loans accounted for at fair value.
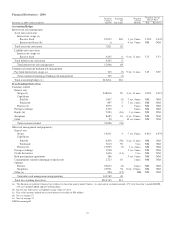
Average trading assets and liabilities consisted of the
following:
Year ended - in millions
December 31
2007
December 31
2006
December 31
2005
Assets
Securities (a) $2,708 $1,712 $1,850
Resale agreements (b) 1,133 623 663
Financial derivatives (c) 1,378 1,148 772
Loans at fair value (c) 166 128
Total assets $5,385 $3,611 $3,285
Liabilities
Securities sold short (d) $1,657 $965 $993
Repurchase agreements
and other borrowings (e) 520 833 1,044
Financial derivatives (f) 1,384 1,103 825
Borrowings at fair
value (f) 39 31
Total liabilities $3,600 $2,932 $2,862
(a) Included in Interest-earning assets-Other on the Average Consolidated
Balance Sheet And Net Interest Analysis.
(b) Included in Federal funds sold and resale agreements.
(c) Included in Noninterest-earning assets-Other.
(d) Included in Other borrowed funds.
(e) Included in Repurchase agreements and Other borrowed funds.
(f) Included in Accrued expenses and other liabilities.
M
ARKET
R
ISK
M
ANAGEMENT
–E
QUITY
A
ND
O
THER
I
NVESTMENT
R
ISK
Equity investment risk is the risk of potential losses associated
with investing in both private and public equity markets. In
addition to extending credit, taking deposits, and underwriting
and trading financial instruments, we make and manage direct
investments in a variety of transactions, including
management buyouts, recapitalizations, and later-stage growth
financings in a variety of industries. We also have investments
in affiliated and non-affiliated funds that make similar
investments in private equity and in debt and equity-oriented
hedge funds. The economic and/or book value of these
investments and other assets such as loan servicing rights are
directly affected by changes in market factors.
The primary risk measurement for equity and other investments
is economic capital. Economic capital is a common measure of
risk for credit, market and operational risk. It is an estimate of the
worst-case value depreciation over one year within a 99.9%
confidence level. Given the illiquid nature of many of these types
of investments, it can be a challenge to determine their fair
values. Market Risk Management and Finance provide
independent oversight of the valuation process.
Various PNC business units manage our private equity and
other investment activities. Our businesses are responsible for
making investment decisions within the approved policy limits
and associated guidelines.
BlackRock
PNC owns approximately 43 million shares of BlackRock
common stock, accounted for under the equity method. Our
total investment in BlackRock was $4.1 billion at
December 31, 2007 compared with $3.9 billion at
December 31, 2006. The market value of our investment in
BlackRock was $9.4 billion at December 31, 2007. The
primary risk measurement, similar to other equity investments,
is economic capital.
Low Income Housing Projects And Historic Tax Credits
Included in our equity investments are limited partnerships
that sponsor affordable housing projects. At December 31,
2007 these investments, consisting of partnerships accounted
for under the equity method as well as equity investments held
by consolidated partnerships, totaled $1.0 billion. The
comparable amount at December 31, 2006 was $708 million.
PNC’s equity investment at risk was $188 million at
December 31, 2007 compared with $134 million at year-end
2006. We also had commitments to make additional equity
investments in affordable housing limited partnerships of $98
million at December 31, 2007 compared with $71 million at
December 31, 2006. At December 31, 2007 historic tax credit
investments totaled $13 million with unfunded commitments
related to these investments of $26 million.
54