PNC Bank 2007 Annual Report Download - page 106
Download and view the complete annual report
Please find page 106 of the 2007 PNC Bank annual report below. You can navigate through the pages in the report by either clicking on the pages listed below, or by using the keyword search tool below to find specific information within the annual report.-
 1
1 -
2
-
3
-
4
-
5
-
6
-
7
-
8
-
9
-
10
-
11
-
12
-
13
-
14
-
15
-
16
-
17
-
18
-
19
-
20
-
21
-
22
-
23
-
24
-
25
-
26
-
27
-
28
-
29
-
30
-
31
-
32
-
33
-
34
-
35
-
36
-
37
-
38
-
39
-
40
-
41
-
42
-
43
-
44
-
45
-
46
-
47
-
48
-
49
-
50
-
51
-
52
-
53
-
54
-
55
-
56
-
57
-
58
-
59
-
60
-
61
-
62
-
63
-
64
-
65
-
66
-
67
-
68
-
69
-
70
-
71
-
72
-
73
-
74
-
75
-
76
-
77
-
78
-
79
-
80
-
81
-
82
-
83
-
84
-
85
-
86
-
87
-
88
-
89
-
90
-
91
-
92
-
93
-
94
-
95
-
 96
96 -
 97
97 -
 98
98 -
 99
99 -
 100
100 -
 101
101 -
 102
102 -
 103
103 -
 104
104 -
 105
105 -
 106
106 -
 107
107 -
 108
108 -
 109
109 -
 110
110 -
 111
111 -
 112
112 -
 113
113 -
 114
114 -
 115
115 -
 116
116 -
117
-
118
-
119
-
120
-
121
-
122
-
123
-
124
-
125
-
126
-
127
-
128
-
129
-
130
-
131
-
132
-
133
-
134
-
135
-
136
-
137
-
138
-
139
-
140
-
141
 |
 |

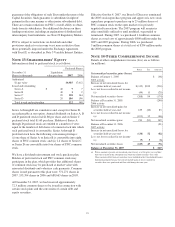
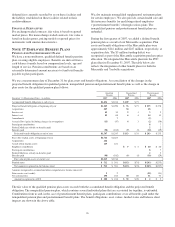
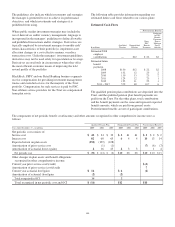
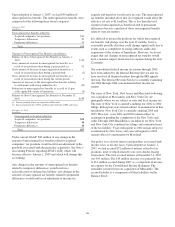
The weighted-average assumptions used (as of the beginning
of each year) to determine net periodic costs were as follows:
Net Periodic Cost Determination
Year ended December 31 2007 2006 2005
Discount rate
Qualified pension 5.70% 5.50% 5.25%
Nonqualified pension 5.60 5.40 5.25
Postretirement benefits 5.80 5.60 5.25
Rate of compensation increase (average) 4.00 4.00 4.00
Assumed health care cost trend rate
Initial trend 10.00 10.00 10.00
Ultimate trend 5.00 5.00 5.00
Year ultimate reached 2012 2011 2010
Expected long-term return on plan assets 8.25 8.25 8.50
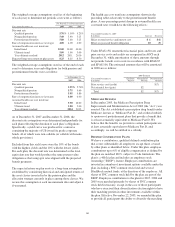
The weighted-average assumptions used (as of the end of each
year) to determine year-end obligations for both pension and
postretirement benefits were as follows:
At December 31
2007 2006
Discount rate
Qualified pension 5.95% 5.70%
Nonqualified pension 5.75 5.60
Postretirement benefits 5.95 5.80
Rate of compensation increase (average) 4.00 4.00
Assumed health care cost trend rate
Initial trend 9.50 10.00
Ultimate trend 5.00 5.00
Year ultimate reached 2014 2012
As of December 31, 2007 and December 31, 2006, the
discount rate assumptions were determined independently for
each plan reflecting the duration of each plan’s obligations.
Specifically, a yield curve was produced for a universe
containing the majority of US-issued Aa grade corporate
bonds, all of which were non-callable (or callable with make-
whole provisions).
Excluded from this yield curve were the 10% of the bonds
with the highest yields and the 10% with the lowest yields.
For each plan, the discount rate was determined as the level
equivalent rate that would produce the same present value
obligation as that using spot rates aligned with the projected
benefit payments.
The expected return on plan assets is a long-term assumption
established by considering historical and anticipated returns of
the asset classes invested in by the pension plan and the
allocation strategy currently in place among those classes. We
review this assumption at each measurement date and adjust it
if warranted.
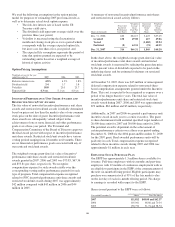
The health care cost trend rate assumptions shown in the
preceding tables relate only to the postretirement benefit
plans. A one-percentage-point change in assumed health care
cost trend rates would have the following effects:
Year ended December 31, 2007
In millions Increase Decrease
Effect on total service and interest cost $ 1 $(1)
Effect on year-end benefit obligation 10 (9)
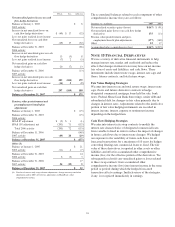
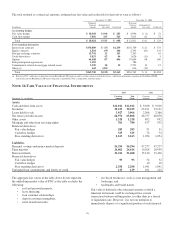
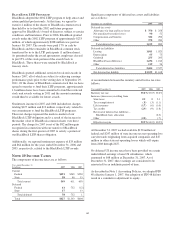
Under SFAS 158, unamortized actuarial gains and losses and
prior service costs and credits are recognized in AOCI each
December 31, while amortization of these amounts through
net periodic benefit cost occurs in accordance with SFAS 87
and SFAS 106. The estimated amounts that will be amortized
in 2008 are as follows:
2008 Estimate
Year ended December 31
In millions
Qualified
Pension
Nonqualified
Pension
Postretirement
Benefits
Prior service cost (credit) $(7)
Net actuarial loss (gain) $2
Total $2 $(7)
M
EDICARE
R
EFORM
In December 2003, the Medicare Prescription Drug
Improvement and Modernization Act of 2003 (the “Act”) was
enacted. The Act established a prescription drug benefit under
Medicare, known as “Medicare Part D,” and a federal subsidy
to sponsors of postretirement plans that provide a benefit that
is at least actuarially equivalent to Medicare Part D. We
believe that the benefits we provide to certain participants are
at least actuarially equivalent to Medicare Part D, and,
accordingly, we will be entitled to a subsidy.
D
EFINED
C
ONTRIBUTION
P
LANS
We have a contributory, qualified defined contribution plan
that covers substantially all employees except those covered
by other plans as identified below. Under this plan, employee
contributions up to 6% of eligible compensation as defined by
the plan are matched 100%, subject to Code limitations. The
plan is a 401(k) plan and includes an employee stock
ownership (“ESOP”) feature. Employee contributions are
invested in a number of investment options available under the
plan, including a PNC common stock fund and several
BlackRock mutual funds, at the direction of the employee. All
shares of PNC common stock held by the plan are part of the
ESOP. Employee contributions to the plan for 2007, 2006 and
2005 were matched primarily by shares of PNC common
stock held in treasury, except in the case of those participants
who have exercised their diversification election rights to have
their matching portion in other investments available within
the plan. Effective November 22, 2005, we amended the plan
to provide all participants the ability to diversify the matching
101