PNC Bank 2007 Annual Report Download - page 43
Download and view the complete annual report
Please find page 43 of the 2007 PNC Bank annual report below. You can navigate through the pages in the report by either clicking on the pages listed below, or by using the keyword search tool below to find specific information within the annual report.-
 1
1 -
2
-
3
-
4
-
5
-
6
-
7
-
8
-
9
-
10
-
11
-
12
-
13
-
14
-
15
-
16
-
17
-
18
-
19
-
20
-
21
-
22
-
23
-
24
-
25
-
26
-
27
-
28
-
29
-
30
-
31
-
32
-
 33
33 -
 34
34 -
 35
35 -
 36
36 -
 37
37 -
 38
38 -
 39
39 -
 40
40 -
 41
41 -
 42
42 -
 43
43 -
 44
44 -
 45
45 -
 46
46 -
 47
47 -
 48
48 -
 49
49 -
 50
50 -
 51
51 -
 52
52 -
 53
53 -
54
-
55
-
56
-
57
-
58
-
59
-
60
-
61
-
62
-
63
-
64
-
65
-
66
-
67
-
68
-
69
-
70
-
71
-
72
-
73
-
74
-
75
-
76
-
77
-
78
-
79
-
80
-
81
-
82
-
83
-
84
-
85
-
86
-
87
-
88
-
89
-
90
-
91
-
92
-
93
-
94
-
95
-
96
-
97
-
98
-
99
-
100
-
101
-
102
-
103
-
104
-
105
-
106
-
107
-
108
-
109
-
110
-
111
-
112
-
113
-
114
-
115
-
116
-
117
-
118
-
119
-
120
-
121
-
122
-
123
-
124
-
125
-
126
-
127
-
128
-
129
-
130
-
131
-
132
-
133
-
134
-
135
-
136
-
137
-
138
-
139
-
140
-
141
 |
 |
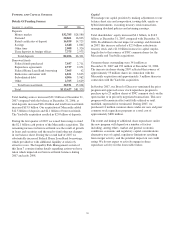
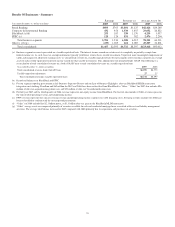
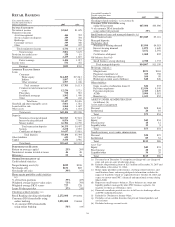
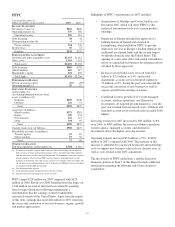
Full-time employees at December 31, 2007 totaled 12,036, an
increase of 2,487 over the prior year. The acquisitions added
approximately 2,300 full-time Retail Banking employees.
Part-time employees have increased by 480 since
December 31, 2006. The increase in part-time employees is a
result of acquisitions and various customer service
enhancement and efficiency initiatives. These initiatives
include utilizing more part-time customer-facing employees
rather than full-time employees during peak business hours.
Growing core checking deposits as a lower-cost funding
source and as the cornerstone product to build customer
relationships is the primary objective of our deposit strategy.
Furthermore, core checking accounts are critical to our
strategy of expanding our payments business. Average total
deposits increased $9.1 billion, or 20%, compared with 2006.
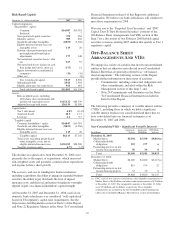
• Certificates of deposits increased $2.8 billion and money
market deposits increased $2.0 billion. These increases
were primarily attributable to acquisitions. The deposit
strategy of Retail Banking is to remain disciplined on
pricing, target specific markets for growth, and focus on
the retention and growth of balances for relationship
customers.
• Average demand deposit growth of $3.6 billion, or 23%,
was almost solely due to acquisitions as the core growth
was impacted by customers shifting funds into higher
yielding deposits in the first part of 2007, small business
sweep checking products, and investment products.
• Small business and consumer-related checking
relationships retention remained strong and stable.
Consumer-related checking relationship retention has
benefited from improved penetration rates of debit cards,
online banking and online bill payment.
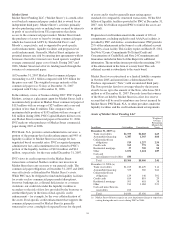
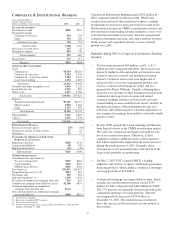
Currently, we are focused on a relationship-based lending
strategy that targets specific customer sectors (homeowners,
small businesses and auto dealerships) while seeking to
maintain a moderate risk profile in the loan portfolio.
• Average commercial and commercial real estate loans
grew $6.8 billion, or 119%, compared with 2006. The
increase is attributable to acquisitions and organic loan
growth on the strength of increased small business loan
demand from existing customers and the acquisition of
new relationships through our sales efforts. At
December 31, 2007, commercial and commercial real
estate loans totaled $14.4 billion. This portfolio included
$3.6 billion of commercial real estate loans, the majority
of which were added with the Mercantile acquisition.
• Average home equity loans grew $396 million, or 3%,
compared with 2006 primarily due to acquisitions.
Consumer loan demand has slowed as a result of the
current rate and economic environment. Our home equity
loan portfolio is relationship based, with 93% of the
portfolio attributable to borrowers in our primary
geographic footprint. We monitor this portfolio closely
and the charge-offs and delinquencies that we have
experienced are within our expectations given current
market conditions.
• Average indirect loans grew $845 million, or 80%,
compared with 2006. The increase is attributable to
acquisitions and growth in our core portfolio that has
benefited from increased sales and marketing efforts.
• Average residential mortgage loans increased $552
million, or 38%, primarily due to the addition of loans
from the acquisitions. In general, the only meaningful
growth in our mortgage portfolio is a result of
acquisitions.
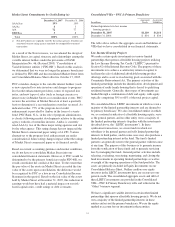
Assets under management of $73 billion at December 31,
2007 increased $19 billion compared with the balance at
December 31, 2006. The increase was primarily attributable to
the Mercantile acquisition and core organic business growth,
partially offset by other declines such as the divestiture of a
Mercantile asset management subsidiary during the fourth
quarter. The remaining portfolio growth was a result of
positive client net asset flows. Client net asset flows are the
result of investment additions from new and existing clients
offset by ordinary course distributions from trust and
investment management accounts and account closures.
Nondiscretionary assets under administration of $113 billion
at December 31, 2007 increased $27 billion compared with the
balance at December 31, 2006, primarily due to the impact of
Mercantile.
See Note 2 Acquisitions and Divestitures in the Notes To
Consolidated Financial Statements in Item 8 of this Report
regarding our planned sale of Hilliard Lyons during the first
half of 2008.
38