PNC Bank 2007 Annual Report Download - page 44
Download and view the complete annual report
Please find page 44 of the 2007 PNC Bank annual report below. You can navigate through the pages in the report by either clicking on the pages listed below, or by using the keyword search tool below to find specific information within the annual report.-
 1
1 -
2
-
3
-
4
-
5
-
6
-
7
-
8
-
9
-
10
-
11
-
12
-
13
-
14
-
15
-
16
-
17
-
18
-
19
-
20
-
21
-
22
-
23
-
24
-
25
-
26
-
27
-
28
-
29
-
30
-
31
-
32
-
33
-
 34
34 -
 35
35 -
 36
36 -
 37
37 -
 38
38 -
 39
39 -
 40
40 -
 41
41 -
 42
42 -
 43
43 -
 44
44 -
 45
45 -
 46
46 -
 47
47 -
 48
48 -
 49
49 -
 50
50 -
 51
51 -
 52
52 -
 53
53 -
 54
54 -
55
-
56
-
57
-
58
-
59
-
60
-
61
-
62
-
63
-
64
-
65
-
66
-
67
-
68
-
69
-
70
-
71
-
72
-
73
-
74
-
75
-
76
-
77
-
78
-
79
-
80
-
81
-
82
-
83
-
84
-
85
-
86
-
87
-
88
-
89
-
90
-
91
-
92
-
93
-
94
-
95
-
96
-
97
-
98
-
99
-
100
-
101
-
102
-
103
-
104
-
105
-
106
-
107
-
108
-
109
-
110
-
111
-
112
-
113
-
114
-
115
-
116
-
117
-
118
-
119
-
120
-
121
-
122
-
123
-
124
-
125
-
126
-
127
-
128
-
129
-
130
-
131
-
132
-
133
-
134
-
135
-
136
-
137
-
138
-
139
-
140
-
141
 |
 |

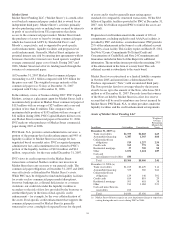
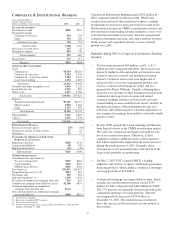
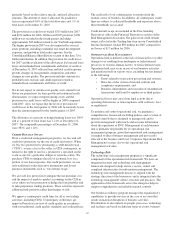
C
ORPORATE
&I
NSTITUTIONAL
B
ANKING
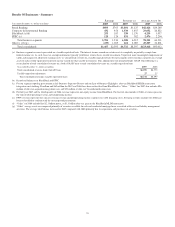
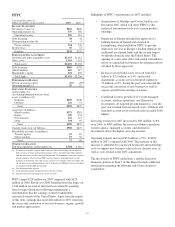
Year ended December 31
Taxable-equivalent basis
Dollars in millions except as noted 2007 2006
I
NCOME
S
TATEMENT
Net interest income $818 $703
Noninterest income
Corporate service fees 564 526
Other 156 226
Noninterest income 720 752
Total revenue 1,538 1,455
Provision for credit losses 125 42
Noninterest expense 818 746
Pretax earnings 595 667
Income taxes 163 213
Earnings $432 $454
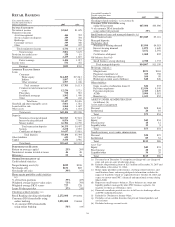
A
VERAGE
B
ALANCE
S
HEET
Loans
Corporate (a) $9,519 $8,633
Commercial real estate 3,590 2,876
Commercial – real estate related 3,580 2,433
Asset-based lending 4,634 4,467
Total loans 21,323 18,409
Goodwill and other intangible assets 1,919 1,352
Loans held for sale 1,319 893
Other assets 4,491 4,168
Total assets $29,052 $24,822
Deposits
Noninterest-bearing demand $7,301 $6,771
Money market 4,784 2,654
Other 1,325 907
Total deposits 13,410 10,332
Other liabilities 3,347 2,863
Capital 2,152 1,838
Total funds $18,909 $15,033
P
ERFORMANCE
R
ATIOS
Return on average capital 20% 25%
Noninterest income to total revenue 47 52
Efficiency 53 51
C
OMMERCIAL
M
ORTGAGE
S
ERVICING
P
ORTFOLIO
(in billions)
Beginning of period $200 $136
Acquisitions/additions 88 102
Repayments/transfers (45) (38)
End of period $243 $200
O
THER
I
NFORMATION
Consolidated revenue from (b):
Treasury management $476 $418
Capital markets $290 $283
Midland Loan Services $220 $184
Total loans (c) $23,861 $18,957
Nonperforming assets (c) (d) $243 $63
Net charge-offs $70 $54
Full-time employees (c) 2,290 1,936
Net gains on commercial mortgage loan sales $39 $55
Commercial mortgage loans held for sale (c) $2,100 $871
Valuation adjustment on commercial
mortgage loans held for sale $(26)
Net carrying amount of commercial mortgage
servicing rights (c) $694 $471
(a) Includes lease financing.
(b) Represents consolidated PNC amounts.
(c) Presented as of period end.
(d) Includes nonperforming loans of $222 million at December 31, 2007 and $50
million at December 31, 2006.
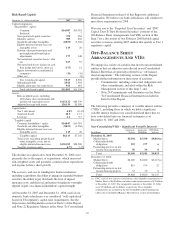
Corporate & Institutional Banking earned $432 million in
2007 compared with $454 million in 2006. While total
revenue increased more than noninterest expense, earnings
declined due to an increase in the provision for credit losses.
Market-related declines in CMBS securitization activities and
non-customer-related trading revenue resulted in a year- over-
year reduction in noninterest income. Treasury management,
commercial mortgage servicing, and capital markets revenues
led by merger and acquisition advisory services showed
growth over 2006.
Highlights during 2007 for Corporate & Institutional Banking
included:
• Total revenue increased $83 million, or 6%, to $1.5
billion for 2007 compared with 2006. The increase was
driven by higher taxable-equivalent net interest income
related to increases in loans and noninterest-bearing
deposits. Corporate service fees were higher due to
increased sales of treasury management products and
services, commercial mortgage servicing, and fees
generated by Harris Williams. Partially offsetting these
increases were declines in other noninterest income from
commercial mortgage loan sale gains and related
economic hedging activities and lower non-customer-
related trading revenue resulting from recent volatility in
the financial markets. Other noninterest income also
reflected a $26 million negative valuation adjustment on
our commercial mortgage loans held for sale in the fourth
quarter of 2007.
• In early 2008, spreads have been widening and there has
been limited activity in the CMBS securitization market.
We value our commercial mortgage loans held for sale
based on securitization prices. Therefore, if these
conditions continue, additional losses will be incurred
that will be significantly higher than the losses incurred
during the fourth quarter of 2007. Currently, these
valuation losses are unrealized (non-cash) and all of the
loans in this portfolio are performing.
• On July 2, 2007, PNC acquired ARCS, a leading
originator and servicer of agency multifamily permanent
financing products, which added a commercial mortgage
servicing portfolio of $13 billion.
• Commercial mortgage servicing-related revenue, which
includes fees and net interest income, totaled $233
million for 2007 compared with $184 million for 2006.
The 27% increase was primarily driven by growth in the
commercial mortgage servicing portfolio. The total
servicing portfolio increased to $243 billion at
December 31, 2007. The related increase in deposits
drove the increase in the net interest income portion of
this revenue.
39