PNC Bank 2007 Annual Report Download - page 91
Download and view the complete annual report
Please find page 91 of the 2007 PNC Bank annual report below. You can navigate through the pages in the report by either clicking on the pages listed below, or by using the keyword search tool below to find specific information within the annual report.-
 1
1 -
2
-
3
-
4
-
5
-
6
-
7
-
8
-
9
-
10
-
11
-
12
-
13
-
14
-
15
-
16
-
17
-
18
-
19
-
20
-
21
-
22
-
23
-
24
-
25
-
26
-
27
-
28
-
29
-
30
-
31
-
32
-
33
-
34
-
35
-
36
-
37
-
38
-
39
-
40
-
41
-
42
-
43
-
44
-
45
-
46
-
47
-
48
-
49
-
50
-
51
-
52
-
53
-
54
-
55
-
56
-
57
-
58
-
59
-
60
-
61
-
62
-
63
-
64
-
65
-
66
-
67
-
68
-
69
-
70
-
71
-
72
-
73
-
74
-
75
-
76
-
77
-
78
-
79
-
80
-
 81
81 -
 82
82 -
 83
83 -
 84
84 -
 85
85 -
 86
86 -
 87
87 -
 88
88 -
 89
89 -
 90
90 -
 91
91 -
 92
92 -
 93
93 -
 94
94 -
 95
95 -
 96
96 -
 97
97 -
 98
98 -
 99
99 -
 100
100 -
 101
101 -
102
-
103
-
104
-
105
-
106
-
107
-
108
-
109
-
110
-
111
-
112
-
113
-
114
-
115
-
116
-
117
-
118
-
119
-
120
-
121
-
122
-
123
-
124
-
125
-
126
-
127
-
128
-
129
-
130
-
131
-
132
-
133
-
134
-
135
-
136
-
137
-
138
-
139
-
140
-
141
 |
 |
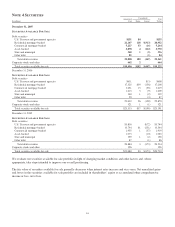
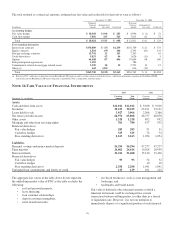
Information relating to securities sold is set forth in the
following table.
Securities Sold
Year ended
December 31
In millions Proceeds
Gross
Gains
Gross
Losses
Net
Gains
(Losses)
Tax
Expense
(Benefit)
2007 $ 6,056 $20 $ 25 $ (5) $ (2)
2006 11,102 2 209 (207) (72)
2005 13,304 19 60 (41) (14)
The fair value of securities pledged to secure public and trust
deposits and repurchase agreements and for other purposes
was $24.2 billion at December 31, 2007 and $10.6 billion at
December 31, 2006. The increase is due primarily to an
increase in securities pledged as collateral for the ability to
borrow from the Federal Reserve Bank of Cleveland. The
pledged securities include positions held in our portfolio of
securities available for sale, trading securities that are included
in other short-term investments on our Consolidated Balance
Sheet, and securities accepted as collateral from others that we
are permitted by contract or custom to sell or repledge.
The fair value of securities accepted as collateral that we are
permitted by contract or custom to sell or repledge was $2.3
billion at December 31, 2007 and $1.4 billion at December 31,
2006 and is a component of federal funds sold and resale
agreements on our Consolidated Balance Sheet. Of the
permitted amount, $1.5 billion was repledged to others at
December 31, 2007 and $1.3 billion was repledged to others at
December 31, 2006. At December 31, 2007 and December 31,
2006, securities accepted as collateral were obtained under
resale agreements. Amounts repledged were used to cover
securities sold short.
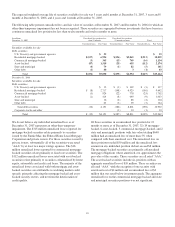
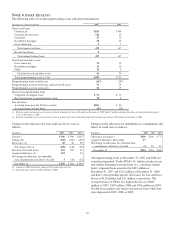
The following table presents, by remaining contractual maturity, the amortized cost, fair value and weighted-average yield of debt
securities at December 31, 2007.
Contractual Maturity Of Debt Securities
December 31, 2007
Dollars in millions 1 Year or Less
After 1 Year
through 5 Years
After 5 Years
through 10 Years
After 10
Years Total
S
ECURITIES
A
VAILABLE
F
OR
S
ALE
U.S. Treasury and government agencies $ 60 $ 85 $ 5 $ 1 $ 151
Residential mortgage-backed 2 24 386 20,735 21,147
Commercial mortgage-backed 149 77 5,001 5,227
Asset-backed 30 669 312 1,867 2,878
State and municipal 18 100 83 139 340
Other debt 6 21 13 45 85
Total debt securities available for sale $ 116 $1,048 $ 876 $27,788 $29,828
Fair value $ 116 $1,045 $ 883 $27,517 $29,561
Weighted-average yield, GAAP basis 4.66% 5.06% 5.02% 5.43% 5.41%
Based on current interest rates and expected prepayment speeds, the total weighted-average expected maturity of mortgage-backed
securities was 3 years and 4 months, of commercial mortgage-backed securities was 4 years and 8 months and of asset-backed
securities was 2 years and 9 months at December 31, 2007. Weighted-average yields are based on historical cost with effective
yields weighted for the contractual maturity of each security.
86