PNC Bank 2007 Annual Report Download - page 45
Download and view the complete annual report
Please find page 45 of the 2007 PNC Bank annual report below. You can navigate through the pages in the report by either clicking on the pages listed below, or by using the keyword search tool below to find specific information within the annual report.-
 1
1 -
2
-
3
-
4
-
5
-
6
-
7
-
8
-
9
-
10
-
11
-
12
-
13
-
14
-
15
-
16
-
17
-
18
-
19
-
20
-
21
-
22
-
23
-
24
-
25
-
26
-
27
-
28
-
29
-
30
-
31
-
32
-
33
-
34
-
 35
35 -
 36
36 -
 37
37 -
 38
38 -
 39
39 -
 40
40 -
 41
41 -
 42
42 -
 43
43 -
 44
44 -
 45
45 -
 46
46 -
 47
47 -
 48
48 -
 49
49 -
 50
50 -
 51
51 -
 52
52 -
 53
53 -
 54
54 -
 55
55 -
56
-
57
-
58
-
59
-
60
-
61
-
62
-
63
-
64
-
65
-
66
-
67
-
68
-
69
-
70
-
71
-
72
-
73
-
74
-
75
-
76
-
77
-
78
-
79
-
80
-
81
-
82
-
83
-
84
-
85
-
86
-
87
-
88
-
89
-
90
-
91
-
92
-
93
-
94
-
95
-
96
-
97
-
98
-
99
-
100
-
101
-
102
-
103
-
104
-
105
-
106
-
107
-
108
-
109
-
110
-
111
-
112
-
113
-
114
-
115
-
116
-
117
-
118
-
119
-
120
-
121
-
122
-
123
-
124
-
125
-
126
-
127
-
128
-
129
-
130
-
131
-
132
-
133
-
134
-
135
-
136
-
137
-
138
-
139
-
140
-
141
 |
 |
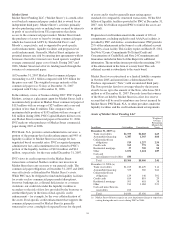
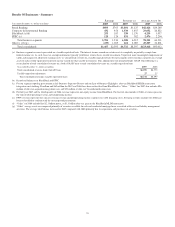
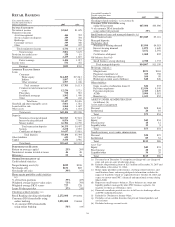
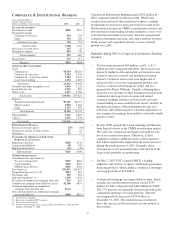
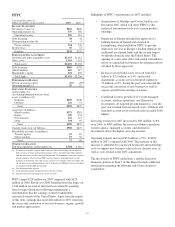
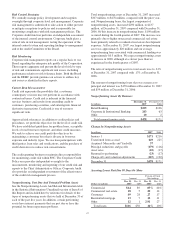
• Average total loan balances increased $2.9 billion or
16%, to $21.3 billion in 2007 compared with 2006. The
Mercantile acquisition accounted for a large part of this
increase and fueled growth in all loan categories.
Continuing customer demand was also a factor in the
increase in corporate loans.
• Commercial mortgage loans held for sale totaled $2.1
billion at December 31, 2007, driven by origination
volumes along with an increase in the holding period
during the second half of 2007 due to adverse market
conditions. Subject to market conditions, our plan is for
held for sale loans to decline as a result of placing loans
in CMBS securitizations and reducing origination
activity in the first half of 2008.
• Beginning in 2008, we elected to identify commercial
mortgage loans held for sale that we intend to securitize
as instruments to be accounted for at fair value under the
provisions of SFAS 159, The Fair Value Option for
Financial Assets and Financial Liabilities – Including an
amendment of FASB Statement No. 115 (SFAS 159. This
change will result in the difference between the cost and
fair value of these instruments being recognized in other
noninterest income, where we also report the change in
fair value of related economic hedging activities. Prior to
the adoption of SFAS 159, under lower-of-cost-or-market
accounting, gains were recognized when loans were sold
and securitized. Losses were recognized either upon sale
and securitization or at quarter-end if cost was greater
than fair value.
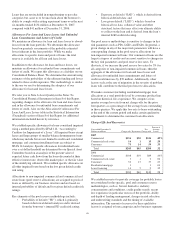
• The provision for credit losses increased $83 million, to
$125 million, in 2007 compared with 2006. This increase
was due to growth in total credit exposure and credit
quality migration primarily related to commercial real
estate exposures.
• Nonperforming assets increased $180 million at
December 31, 2007 compared with December 31, 2006.
Higher nonaccrual loans, the largest component of
nonperforming assets, were driven by increases in
commercial real estate and commercial real estate related
loans. Of this increase, $102 million occurred during the
fourth quarter of 2007. Included in the December 31,
2007 amount was $103 million of nonperforming assets
associated with the Mercantile portfolio. Given the
current environment, we believe provision levels and
nonperforming assets will continue to rise in 2008.
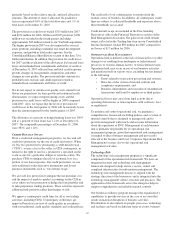
• Average deposit balances for 2007 increased $3.1 billion,
or 30%, to $13.4 billion in 2007 compared with 2006.
The increase in corporate money market deposits
reflected PNC’s action to avail itself of the opportunity to
obtain funding from alternative sources. Growth in
noninterest-bearing deposits was attributable primarily to
our commercial mortgage servicing portfolio. In the
current interest rate environment, deposits in this
business segment will be less valuable and we expect the
percentage growth in net interest income in 2008 to be
less than it was in 2007.
• Noninterest expense increased by $72 million, or 10%, to
$818 million in 2007 compared with 2006. This increase
reflected the impact of acquisitions as well as expenses
associated with other growth and fee-based initiatives
and customer growth. In addition, the noninterest
expense increases reflected our business of originating
transactions whose returns are heavily dependent on tax
credits, whereby losses are taken through noninterest
expense and the associated benefits result in a lower
provision for income taxes. These losses were $25
million higher in 2007 compared with 2006.
See the additional revenue discussion regarding treasury
management and capital markets-related products and
Midland Loan Services on page 24.
40