PNC Bank 2007 Annual Report Download - page 118
Download and view the complete annual report
Please find page 118 of the 2007 PNC Bank annual report below. You can navigate through the pages in the report by either clicking on the pages listed below, or by using the keyword search tool below to find specific information within the annual report.-
 1
1 -
2
-
3
-
4
-
5
-
6
-
7
-
8
-
9
-
10
-
11
-
12
-
13
-
14
-
15
-
16
-
17
-
18
-
19
-
20
-
21
-
22
-
23
-
24
-
25
-
26
-
27
-
28
-
29
-
30
-
31
-
32
-
33
-
34
-
35
-
36
-
37
-
38
-
39
-
40
-
41
-
42
-
43
-
44
-
45
-
46
-
47
-
48
-
49
-
50
-
51
-
52
-
53
-
54
-
55
-
56
-
57
-
58
-
59
-
60
-
61
-
62
-
63
-
64
-
65
-
66
-
67
-
68
-
69
-
70
-
71
-
72
-
73
-
74
-
75
-
76
-
77
-
78
-
79
-
80
-
81
-
82
-
83
-
84
-
85
-
86
-
87
-
88
-
89
-
90
-
91
-
92
-
93
-
94
-
95
-
96
-
97
-
98
-
99
-
100
-
101
-
102
-
103
-
104
-
105
-
106
-
107
-
 108
108 -
 109
109 -
 110
110 -
 111
111 -
 112
112 -
 113
113 -
 114
114 -
 115
115 -
 116
116 -
 117
117 -
 118
118 -
 119
119 -
 120
120 -
 121
121 -
 122
122 -
 123
123 -
 124
124 -
 125
125 -
 126
126 -
 127
127 -
 128
128 -
129
-
130
-
131
-
132
-
133
-
134
-
135
-
136
-
137
-
138
-
139
-
140
-
141
 |
 |

N
OTE
25 P
ARENT
C
OMPANY
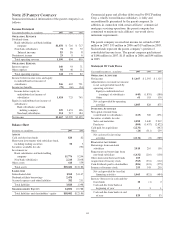
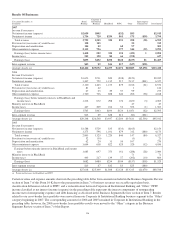
Summarized financial information of the parent company is as
follows:
Income Statement
Year ended December 31 - in millions 2007 2006 2005
O
PERATING
R
EVENUE
Dividends from:
Bank subsidiaries and bank holding
company $1,078 $ 710 $ 717
Non-bank subsidiaries 74 69 72
Interest income 15 16 8
Noninterest income 23 96
Total operating revenue 1,190 804 803
O
PERATING
E
XPENSE
Interest expense 160 93 71
Other expense 84 46 11
Total operating expense 244 139 82
Income before income taxes and equity
in undistributed net income of
subsidiaries 946 665 721
Income tax benefits (78) (60) (24)
Income before equity in
undistributed net income of
subsidiaries 1,024 725 745
Equity in undistributed net income of
subsidiaries:
Bank subsidiaries and bank
holding company 229 1,653 396
Non-bank subsidiaries 214 217 184
Net income $1,467 $2,595 $1,325
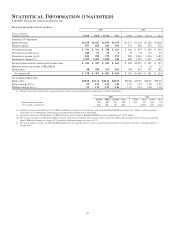
Balance Sheet
December 31 - in millions 2007 2006
A
SSETS
Cash and due from banks $20 $2
Short-term investments with subsidiary bank,
including trading securities 58 3
Securities available for sale 290
Investments in:
Bank subsidiaries and bank holding
company 15,776 9,294
Non-bank subsidiaries 2,214 2,038
Other assets 614 559
Total assets $18,682 $12,186
L
IABILITIES
Subordinated debt $968 $1,147
Nonbank affiliate borrowings 2,478
Accrued expenses and other liabilities 382 251
Total liabilities 3,828 1,398
S
HAREHOLDERS
’E
QUITY
14,854 10,788
Total liabilities and shareholders’ equity $18,682 $12,186
Commercial paper and all other debt issued by PNC Funding
Corp, a wholly owned finance subsidiary, is fully and
unconditionally guaranteed by the parent company. In
addition, in connection with certain affiliates’ commercial
mortgage servicing operations, the parent company has
committed to maintain such affiliates’ net worth above
minimum requirements.
The parent company received net income tax refunds of $65
million in 2007, $35 million in 2006 and $19 million in 2005.
Such refunds represent the parent company’s portion of
consolidated income taxes. The parent company paid interest
of $146 million in 2007, $113 million in 2006 and $94 million
in 2005.
Statement Of Cash Flows
Year ended December 31 - in millions 2007 2006 2005
O
PERATING
A
CTIVITIES
Net income $ 1,467 $ 2,595 $ 1,325
Adjustments to reconcile net income
to net cash provided (used) by
operating activities:
Equity in undistributed net
(earnings) of subsidiaries (443) (1,870) (580)
Other 61 103 130
Net cash provided by operating
activities 1,085 828 875
I
NVESTING
A
CTIVITIES
Net capital returned from
(contributed to) subsidiaries (165) 300 (271)
Securities available for sale:
Sales and maturities 1,090 3,440 2,912
Purchases (800) (3,437) (2,822)
Cash paid for acquisitions (2,231) (447)
Other (26) (311) 239
Net cash used in investing
activities (2,132) (8) (389)
F
INANCING
A
CTIVITIES
Borrowings from non-bank
subsidiary 3,910 210 150
Repayments on borrowings from
non-bank subsidiary (1,432) (210) (150)
Other short-term borrowed funds 103
Acquisition of treasury stock (963) (531) (112)
Cash dividends paid to shareholders (806) (633) (575)
Issuance of treasury stock 253 343 203
Net cash provided by (used in)
financing activities 1,065 (821) (484)
Increase (decrease) in cash and due
from banks 18 (1) 2
Cash and due from banks at
beginning of year 231
Cash and due from banks at end
of year $20 $2 $3
113