PNC Bank 2007 Annual Report Download - page 41
Download and view the complete annual report
Please find page 41 of the 2007 PNC Bank annual report below. You can navigate through the pages in the report by either clicking on the pages listed below, or by using the keyword search tool below to find specific information within the annual report.-
 1
1 -
2
-
3
-
4
-
5
-
6
-
7
-
8
-
9
-
10
-
11
-
12
-
13
-
14
-
15
-
16
-
17
-
18
-
19
-
20
-
21
-
22
-
23
-
24
-
25
-
26
-
27
-
28
-
29
-
30
-
 31
31 -
 32
32 -
 33
33 -
 34
34 -
 35
35 -
 36
36 -
 37
37 -
 38
38 -
 39
39 -
 40
40 -
 41
41 -
 42
42 -
 43
43 -
 44
44 -
 45
45 -
 46
46 -
 47
47 -
 48
48 -
 49
49 -
 50
50 -
 51
51 -
52
-
53
-
54
-
55
-
56
-
57
-
58
-
59
-
60
-
61
-
62
-
63
-
64
-
65
-
66
-
67
-
68
-
69
-
70
-
71
-
72
-
73
-
74
-
75
-
76
-
77
-
78
-
79
-
80
-
81
-
82
-
83
-
84
-
85
-
86
-
87
-
88
-
89
-
90
-
91
-
92
-
93
-
94
-
95
-
96
-
97
-
98
-
99
-
100
-
101
-
102
-
103
-
104
-
105
-
106
-
107
-
108
-
109
-
110
-
111
-
112
-
113
-
114
-
115
-
116
-
117
-
118
-
119
-
120
-
121
-
122
-
123
-
124
-
125
-
126
-
127
-
128
-
129
-
130
-
131
-
132
-
133
-
134
-
135
-
136
-
137
-
138
-
139
-
140
-
141
 |
 |

R
ETAIL
B
ANKING
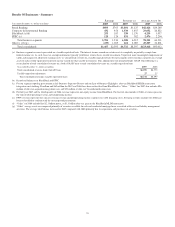
Year ended December 31
Taxable-equivalent basis
Dollars in millions 2007 2006
I
NCOME
S
TATEMENT
Net interest income $2,065 $1,678
Noninterest income
Asset management 466 352
Service charges on deposits 339 304
Brokerage 269 236
Consumer services 399 348
Other 263 207
Total noninterest income 1,736 1,447
Total revenue 3,801 3,125
Provision for credit losses 138 81
Noninterest expense 2,239 1,827
Pretax earnings 1,424 1,217
Income taxes 531 452
Earnings $893 $765
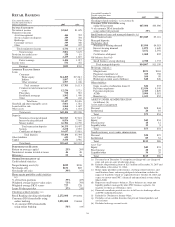
A
VERAGE
B
ALANCE
S
HEET
Loans
Consumer
Home equity $14,209 $13,813
Indirect 1,897 1,052
Other consumer 1,597 1,248
Total consumer 17,703 16,113
Commercial and commercial real
estate 12,534 5,721
Floor plan 978 910
Residential mortgage 1,992 1,440
Other 230 242
Total loans 33,437 24,426
Goodwill and other intangible assets 5,061 1,581
Loans held for sale 1,564 1,607
Other assets 2,362 1,634
Total assets $42,424 $29,248
Deposits
Noninterest-bearing demand $10,513 $7,841
Interest-bearing demand 8,876 7,906
Money market 16,786 14,750
Total transaction deposits 36,175 30,497
Savings 2,678 2,035
Certificates of deposit 16,637 13,861
Total deposits 55,490 46,393
Other liabilities 621 553
Capital 3,558 2,986
Total funds $59,669 $49,932
P
ERFORMANCE
R
ATIOS
Return on average capital 25% 26%
Noninterest income to total revenue 46 46
Efficiency 59 58
O
THER
I
NFORMATION
(a)
Credit-related statistics:
Nonperforming assets (b) $225 $106
Net charge-offs $131 $85
Net charge-off ratio .39% .35%
Home equity portfolio credit statistics:
(c)
% of first lien positions 39% 43%
Weighted average loan-to-value ratios 73% 70%
Weighted average FICO scores 727 728
Loans 90 days past due .37% .24%
Checking-related statistics: (c)
Retail Banking checking relationships 2,272,000 1,954,000
Consumer DDA households using
online banking 1,091,000 938,000
% of consumer DDA households
using online banking 54% 53%
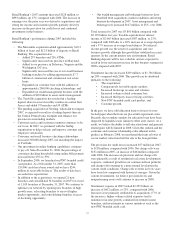
Year ended December 31
Taxable-equivalent basis
Dollars in millions 2007 2006
Checking-related statistics: (c) (continued)
Consumer DDA households using
online bill payment 667,000 404,000
% of consumer DDA households
using online bill payment 33% 23%
Small business loans and managed deposits: (c)
Small business loans $13,049 $5,116
Managed deposits:
On-balance sheet
Noninterest-bearing demand $5,994 $4,383
Interest-bearing demand 1,873 1,649
Money market 3,152 2,592
Certificates of deposit 1,068 802
Off-balance sheet (d)
Small business sweep checking 2,780 1,733
Total managed deposits $14,867 $11,159
Brokerage statistics:
Margin loans $151 $163
Financial consultants (e) 769 758
Full service brokerage offices 100 99
Brokerage account assets (billions) $48 $46
Other statistics:
Gains on sales of education loans (f) $24 $33
Full-time employees 12,036 9,549
Part-time employees 2,309 1,829
ATMs 3,900 3,581
Branches (g) 1,109 852
ASSETS UNDER ADMINISTRATION
(in billions) (h)
Assets under management
Personal $53 $44
Institutional 20 10
Total $73 $54
Asset Type
Equity $42 $34
Fixed income 18 12
Liquidity/other 13 8
Total $73 $54
Nondiscretionary assets under administration
Personal $30 $25
Institutional 83 61
Total $113 $86
Asset Type
Equity $49 $33
Fixed income 28 24
Liquidity/other 36 29
Total $113 $86
(a) Presented as of December 31 except for net charge-offs, net charge-off
ratio, and gains on sales of education loans.
(b) Includes nonperforming loans of $215 million at December 31, 2007 and
$96 million at December 31, 2006.
(c) Home equity portfolio credit statistics, checking-related statistics, and
small business loans and managed deposits information excludes the
impact of Yardville, which we acquired effective October 26, 2007 and
expect to convert onto PNC’s financial and operational systems during
March 2008.
(d) Represents small business balances. These balances are swept into
liquidity products managed by other PNC business segments, the
majority of which are off-balance sheet.
(e) Financial consultants provide services in full service brokerage offices
and PNC traditional branches.
(f) Included in “Noninterest income-Other.”
(g) Excludes certain satellite branches that provide limited products and
service hours.
(h) Excludes brokerage account assets.
36