PNC Bank 2007 Annual Report Download - page 25
Download and view the complete annual report
Please find page 25 of the 2007 PNC Bank annual report below. You can navigate through the pages in the report by either clicking on the pages listed below, or by using the keyword search tool below to find specific information within the annual report.-
 1
1 -
2
-
3
-
4
-
5
-
6
-
7
-
8
-
9
-
10
-
11
-
12
-
13
-
14
-
 15
15 -
 16
16 -
 17
17 -
 18
18 -
 19
19 -
 20
20 -
 21
21 -
 22
22 -
 23
23 -
 24
24 -
 25
25 -
 26
26 -
 27
27 -
 28
28 -
 29
29 -
 30
30 -
 31
31 -
 32
32 -
 33
33 -
 34
34 -
 35
35 -
36
-
37
-
38
-
39
-
40
-
41
-
42
-
43
-
44
-
45
-
46
-
47
-
48
-
49
-
50
-
51
-
52
-
53
-
54
-
55
-
56
-
57
-
58
-
59
-
60
-
61
-
62
-
63
-
64
-
65
-
66
-
67
-
68
-
69
-
70
-
71
-
72
-
73
-
74
-
75
-
76
-
77
-
78
-
79
-
80
-
81
-
82
-
83
-
84
-
85
-
86
-
87
-
88
-
89
-
90
-
91
-
92
-
93
-
94
-
95
-
96
-
97
-
98
-
99
-
100
-
101
-
102
-
103
-
104
-
105
-
106
-
107
-
108
-
109
-
110
-
111
-
112
-
113
-
114
-
115
-
116
-
117
-
118
-
119
-
120
-
121
-
122
-
123
-
124
-
125
-
126
-
127
-
128
-
129
-
130
-
131
-
132
-
133
-
134
-
135
-
136
-
137
-
138
-
139
-
140
-
141
 |
 |

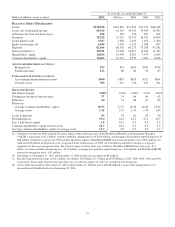
income. Noninterest income represented 57% of total
revenue for 2007.
• Overall asset quality remained strong, reflecting our
commitment to maintain a moderate risk profile.
While nonperforming assets increased in 2007
compared with 2006, the coverage ratio of the
allowance for loan and lease losses to nonperforming
loans was 190% and the allowance for loan and lease
losses to total loans increased to 1.21% at
December 31, 2007.
• PNC continued to be well capitalized and maintained
a strong liquidity position.
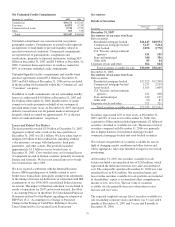
• At December 31, 2007, our investment in BlackRock
was $4.1 billion and, based upon the closing price of
BlackRock’s common stock on that date, we had an
additional $5.3 billion of pretax value that was not
recognized.
B
ALANCE
S
HEET
H
IGHLIGHTS
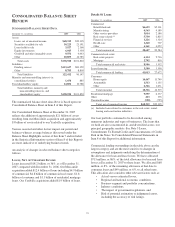
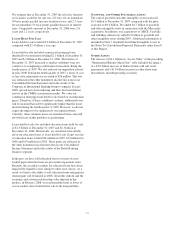
Total assets were $138.9 billion at December 31, 2007
compared with $101.8 billion at December 31, 2006. The
increase compared with December 31, 2006 was primarily due
to the addition of approximately $21 billion of assets related
to the Mercantile acquisition, growth in loans and higher
securities available for sale.
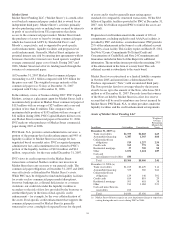
Total average assets were $123.4 billion for 2007 compared
with $95.0 billion for 2006. This increase reflected a $20.3
billion increase in average interest-earning assets and an
increase in average other noninterest-earning assets. An
increase of $12.9 billion in loans and a $5.2 billion increase in
securities available for sale were the primary factors for the
increase in average interest-earning assets.
The increase in average other noninterest-earning assets for
2007 reflected our equity investment in BlackRock, which
averaged $3.8 billion for 2007 and which had been
consolidated for the first nine months of 2006, and an increase
in average goodwill of $3.6 billion primarily related to the
Mercantile and Yardville acquisitions.
Average total loans were $62.5 billion for 2007 and $49.6 billion
for 2006. The increase in average total loans included the effect
of the Mercantile acquisition for 10 months of 2007 and higher
commercial loans. The increase in average total loans included
growth in commercial loans of $5.3 billion and growth in
commercial real estate loans of $4.5 billion. Loans represented
64% of average interest-earning assets for both 2007 and 2006.
Average securities available for sale totaled $26.5 billion for
2007 and $21.3 billion for 2006. The 10-month impact of
Mercantile contributed to the increase in average securities for
the 2007 period, along with overall balance sheet growth.
Securities available for sale comprised 27% of average
interest-earning assets for both 2007 and 2006.
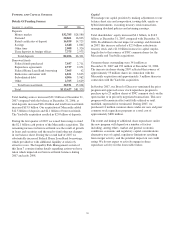
Average total deposits were $76.8 billion for 2007, an increase
of $13.5 billion over 2006. Average deposits grew from the
prior year primarily as a result of an increase in money
market, noninterest-bearing demand deposits and retail
certificates of deposit. These increases reflected the 10-month
impact of the Mercantile acquisition and growth in deposits in
Corporate & Institutional Banking.
Average total deposits represented 62% of average total assets
for 2007 and 67% for 2006. Average transaction deposits were
$50.7 billion for 2007 compared with $42.3 billion for 2006.
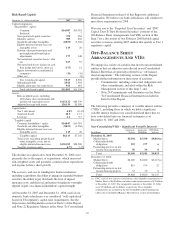
Average borrowed funds were $23.0 billion for 2007 and
$15.0 billion for 2006. Increases of $3.2 billion in bank notes
and senior debt, $2.5 billion in federal funds purchased and
$1.5 billion in Federal Home Loan bank borrowings drove the
increase in average borrowed funds compared with 2006.
Shareholders’ equity totaled $14.9 billion at December 31,
2007, compared with $10.8 billion at December 31, 2006. The
increase resulted primarily from the Mercantile and Yardville
acquisitions. See the Consolidated Balance Sheet Review
section of this Item 7 for additional information.
L
INE OF
B
USINESS
H
IGHLIGHTS
We refer you to Item 1 of this Report under the captions
Business Overview and Review of Lines of Business for an
overview of our business segments and to the Business
Segments Review section of this Item 7 for a Results Of
Businesses – Summary table and further analysis of business
segment results for 2007 and 2006, including presentation
differences from Note 26. Total business segment earnings
were $1.7 billion for 2007 and $1.5 billion for 2006.
We provide a reconciliation of total business segment earnings
to total PNC consolidated net income as reported on a GAAP
basis in Note 26 Segment Reporting in the Notes To
Consolidated Financial Statements in Item 8 of this Report.
Retail Banking
Retail Banking’s 2007 earnings increased $128 million, to
$893 million, up 17% compared with 2006. The increase in
earnings over the prior year was driven by acquisitions and
strong fee income and customer growth, partially offset by
increases in the provision for credit losses and continued
investments in the business.
Corporate & Institutional Banking
Corporate & Institutional Banking earned $432 million in
2007 compared with $454 million in 2006. While total
revenue increased more than noninterest expense, earnings
declined due to an increase in the provision for credit losses.
Market-related declines in commercial mortgage- backed
securities (“CMBS”) securitization activities and
non-customer-related trading revenue resulted in a year-over-
year reduction in noninterest income.
20