PNC Bank 2007 Annual Report Download - page 90
Download and view the complete annual report
Please find page 90 of the 2007 PNC Bank annual report below. You can navigate through the pages in the report by either clicking on the pages listed below, or by using the keyword search tool below to find specific information within the annual report.-
 1
1 -
2
-
3
-
4
-
5
-
6
-
7
-
8
-
9
-
10
-
11
-
12
-
13
-
14
-
15
-
16
-
17
-
18
-
19
-
20
-
21
-
22
-
23
-
24
-
25
-
26
-
27
-
28
-
29
-
30
-
31
-
32
-
33
-
34
-
35
-
36
-
37
-
38
-
39
-
40
-
41
-
42
-
43
-
44
-
45
-
46
-
47
-
48
-
49
-
50
-
51
-
52
-
53
-
54
-
55
-
56
-
57
-
58
-
59
-
60
-
61
-
62
-
63
-
64
-
65
-
66
-
67
-
68
-
69
-
70
-
71
-
72
-
73
-
74
-
75
-
76
-
77
-
78
-
79
-
 80
80 -
 81
81 -
 82
82 -
 83
83 -
 84
84 -
 85
85 -
 86
86 -
 87
87 -
 88
88 -
 89
89 -
 90
90 -
 91
91 -
 92
92 -
 93
93 -
 94
94 -
 95
95 -
 96
96 -
 97
97 -
 98
98 -
 99
99 -
 100
100 -
101
-
102
-
103
-
104
-
105
-
106
-
107
-
108
-
109
-
110
-
111
-
112
-
113
-
114
-
115
-
116
-
117
-
118
-
119
-
120
-
121
-
122
-
123
-
124
-
125
-
126
-
127
-
128
-
129
-
130
-
131
-
132
-
133
-
134
-
135
-
136
-
137
-
138
-
139
-
140
-
141
 |
 |

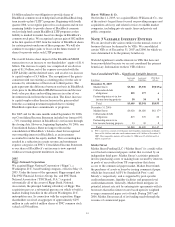
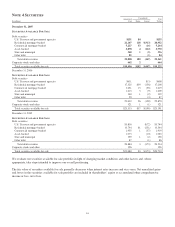
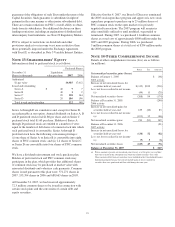
The expected weighted-average life of securities available for sale was 3 years and 6 months at December 31, 2007, 3 years and 8
months at December 31, 2006, and 4 years and 1 month at December 31, 2005.
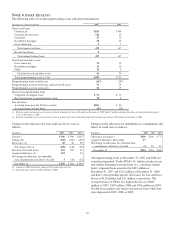
The following table presents unrealized loss and fair value of securities at December 31, 2007 and December 31, 2006 for which an
other-than-temporary impairment has not been recognized. These securities are segregated between investments that have been in a
continuous unrealized loss position for less than twelve months and twelve months or more.
In millions
December 31, 2007
Unrealized loss position less
than 12 months
Unrealized loss position
12 months or more Total
Unrealized Loss Fair Value Unrealized Loss Fair Value Unrealized Loss Fair Value
Securities available for sale
Debt securities
U.S. Treasury and government agencies $53 $ 53
Residential mortgage-backed $(157) 6,994 $(156) $5,065 $(313) 12,059
Commercial mortgage-backed (3) 365 (13) 769 (16) 1,134
Asset-backed (87) 1,519 (25) 655 (112) 2,174
State and municipal (4) 79 (1) 82 (5) 161
Other debt (1) 40 3 (1) 43
Total $(252) $9,050 $(195) $6,574 $(447) $15,624
December 31, 2006
Securities available for sale
Debt securities
U.S. Treasury and government agencies $ 15 $ (3) $ 302 $ (3) $ 317
Residential mortgage-backed $ (8) 2,717 (148) 6,925 (156) 9,642
Commercial mortgage-backed (3) 924 (22) 778 (25) 1,702
Asset-backed (1) 414 (8) 649 (9) 1,063
State and municipal 16 (2) 88 (2) 104
Other debt 65 (3) 59 (3) 124
Total debt securities (12) 4,151 (186) 8,801 (198) 12,952
Corporate stocks and other (1) 10 (1) 10
Total $ (12) $4,151 $(187) $8,811 $(199) $12,962
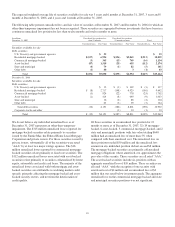
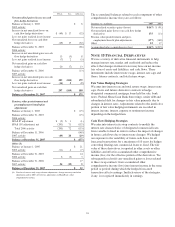
We do not believe any individual unrealized loss as of
December 31, 2007 represents an other-than-temporary
impairment. The $313 million unrealized losses reported for
mortgage-backed securities relate primarily to securities
issued by the Fannie Mae, the Federal Home Loan Mortgage
Corporation and private issuers. For those securities issued by
private issuers, substantially all of the securities were rated
“AAA” by at least two major ratings agencies. The $16
million unrealized losses reported for commercial mortgage-
backed securities relate primarily to fixed rate securities. The
$112 million unrealized losses associated with asset-backed
securities relate primarily to securities collateralized by home
equity, automobile and credit card loans. The majority of the
unrealized losses associated with both mortgage and asset-
backed securities are attributable to widening market credit
spreads, primarily affecting the mortgage-backed and asset-
backed security sectors, and not from the deterioration of
credit quality.
Of those securities in an unrealized loss position for 12
months or more as of December 31, 2007, 32 (19 mortgage-
backed, 6 asset-backed, 5 commercial mortgage-backed, and 2
state and municipal) positions with fair value totaling $640
million had an unrealized loss of more than 5% when
compared with their amortized cost. The unrealized loss on
these positions totaled $50 million and the unrealized loss
amount on any individual position did not exceed $8 million.
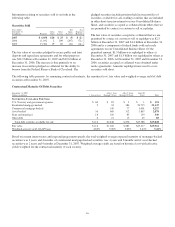
The mortgage-backed securities are primarily collateralized
mortgage obligations where amortized cost approximates the
par value of the security. These securities are all rated “AAA.”
The asset-backed securities include six positions with an
aggregate unrealized loss of $10 million. These securities are
all rated “AAA” with the exception of one security with
amortized cost of $4 million and an unrealized loss of $2
million that was rated below investment grade. The aggregate
unrealized loss on the commercial mortgage-backed and state
and municipal securities positions was not significant.
85