PNC Bank 2007 Annual Report Download - page 63
Download and view the complete annual report
Please find page 63 of the 2007 PNC Bank annual report below. You can navigate through the pages in the report by either clicking on the pages listed below, or by using the keyword search tool below to find specific information within the annual report.-
 1
1 -
2
-
3
-
4
-
5
-
6
-
7
-
8
-
9
-
10
-
11
-
12
-
13
-
14
-
15
-
16
-
17
-
18
-
19
-
20
-
21
-
22
-
23
-
24
-
25
-
26
-
27
-
28
-
29
-
30
-
31
-
32
-
33
-
34
-
35
-
36
-
37
-
38
-
39
-
40
-
41
-
42
-
43
-
44
-
45
-
46
-
47
-
48
-
49
-
50
-
51
-
52
-
 53
53 -
 54
54 -
 55
55 -
 56
56 -
 57
57 -
 58
58 -
 59
59 -
 60
60 -
 61
61 -
 62
62 -
 63
63 -
 64
64 -
 65
65 -
 66
66 -
 67
67 -
 68
68 -
 69
69 -
 70
70 -
 71
71 -
 72
72 -
 73
73 -
74
-
75
-
76
-
77
-
78
-
79
-
80
-
81
-
82
-
83
-
84
-
85
-
86
-
87
-
88
-
89
-
90
-
91
-
92
-
93
-
94
-
95
-
96
-
97
-
98
-
99
-
100
-
101
-
102
-
103
-
104
-
105
-
106
-
107
-
108
-
109
-
110
-
111
-
112
-
113
-
114
-
115
-
116
-
117
-
118
-
119
-
120
-
121
-
122
-
123
-
124
-
125
-
126
-
127
-
128
-
129
-
130
-
131
-
132
-
133
-
134
-
135
-
136
-
137
-
138
-
139
-
140
-
141
 |
 |

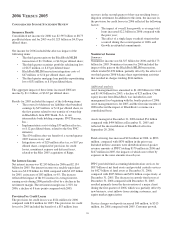
2006 V
ERSUS
2005
C
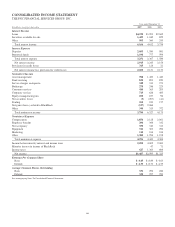
ONSOLIDATED
I
NCOME
S
TATEMENT
R
EVIEW
Summary Results
Consolidated net income for 2006 was $2.595 billion or $8.73
per diluted share and for 2005 was $1.325 billion or $4.55 per
diluted share.
Net income for 2006 included the after-tax impact of the
following items:
• The third quarter gain on the BlackRock/MLIM
transaction of $1.3 billion, or $4.36 per diluted share;
• The third quarter securities portfolio rebalancing loss
of $127 million, or $.43 per diluted share;
• BlackRock/MLIM transaction integration costs of
$47 million, or $.16 per diluted share, and
• The third quarter mortgage loan portfolio repositioning
loss of $31 million, or $.10 per diluted share.
The aggregate impact of these items increased 2006 net
income by $1.1 billion, or $3.67 per diluted share.
Results for 2005 included the impact of the following items:
• The reversal of deferred tax liabilities that benefited
earnings by $45 million, or $.16 per diluted share, in
the first quarter related to our transfer of ownership
in BlackRock from PNC Bank, N.A. to our
intermediate bank holding company, PNC Bancorp,
Inc.;
• Implementation costs totaling $35 million after-tax,
or $.12 per diluted share, related to the One PNC
initiative;
• The $34 million after-tax benefit of a second quarter
2005 loan recovery; and
• Integration costs of $20 million after-tax, or $.07 per
diluted share, comprised of provision for credit
losses, noninterest expense and deferred taxes,
related to the May 2005 acquisition of Riggs.
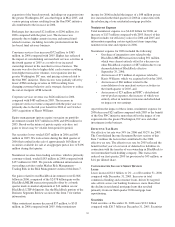
Net Interest Income
Net interest income was $2.245 billion for 2006 and $2.154
billion for 2005. Net interest income on a taxable-equivalent
basis was $2.270 billion for 2006 compared with $2.187 billion
for 2005, an increase of $83 million, or 4%. The increase
reflected the impact of the 6% increase in average interest-
earning assets during 2006 partially offset by a decline in the
net interest margin. The net interest margin was 2.92% for
2006, a decline of 8 basis points compared with 2005.
Provision For Credit Losses
The provision for credit losses was $124 million for 2006
compared with $21 million for 2005. The provision for credit
losses for 2005 included the benefit of a $53 million loan
recovery in the second quarter of that year resulting from a
litigation settlement. In addition to this item, the increase in
the provision for credit losses in 2006 reflected the following
factors:
• The impact of overall loan growth, as average total
loans increased $2.2 billion in 2006 compared with
the prior year;
• The effect of a single large overdraft situation that
occurred during the second quarter of 2006, and
• Growth in unfunded commitments.
Noninterest Income
Summary
Noninterest income was $6.327 billion for 2006 and $4.173
billion for 2005. Noninterest income for 2006 included the
impact of the gain on the BlackRock/MLIM transaction,
which totaled $2.078 billion, partially offset by the effects of
our third quarter 2006 balance sheet repositioning activities
that resulted in charges totaling $244 million.
Additional analysis
Asset management fees amounted to $1.420 billion for 2006
and $1.443 billion for 2005, a decline of $23 million. Our
equity income from BlackRock was included in asset
management fees beginning with the fourth quarter of 2006.
Asset management fees for 2005 and the first nine months of
2006 reflected the impact of BlackRock’s revenue on a
consolidated basis.
Assets managed at December 31, 2006 totaled $54 billion
compared with $494 billion at December 31, 2005 and
reflected the deconsolidation of BlackRock effective
September 29, 2006.
Fund servicing fees increased $23 million in 2006, to $893
million, compared with $870 million in the prior year.
Included in these amounts were distribution/out-of-pocket
revenue amounts at PFPC totaling $170 million in 2006 and
$147 million in 2005, the impacts of which were offset by
expenses in the same amounts in each year.
PFPC provided fund accounting/administration services for
$837 billion of net fund assets and provided custody services
for $427 billion of fund assets at December 31, 2006,
compared with $835 billion and $476 billion, respectively, at
December 31, 2005. The decrease in custody fund assets at
December 31, 2006 compared with December 31, 2005
resulted primarily from the deconversion of a major client
during the first quarter of 2006, which was partially offset by
new business, asset inflows from existing customers, and
equity market appreciation.
Service charges on deposits increased $40 million, to $313
million, for 2006 compared with 2005. Customer growth,
58