Nokia 2012 Annual Report Download - page 84
Download and view the complete annual report
Please find page 84 of the 2012 Nokia annual report below. You can navigate through the pages in the report by either clicking on the pages listed below, or by using the keyword search tool below to find specific information within the annual report.-
 1
1 -
2
-
3
-
4
-
5
-
6
-
7
-
8
-
9
-
10
-
11
-
12
-
13
-
14
-
15
-
16
-
17
-
18
-
19
-
20
-
21
-
22
-
23
-
24
-
25
-
26
-
27
-
28
-
29
-
30
-
31
-
32
-
33
-
34
-
35
-
36
-
37
-
38
-
39
-
40
-
41
-
42
-
43
-
44
-
45
-
46
-
47
-
48
-
49
-
50
-
51
-
52
-
53
-
54
-
55
-
56
-
57
-
58
-
59
-
60
-
61
-
62
-
63
-
64
-
65
-
66
-
67
-
68
-
69
-
70
-
71
-
72
-
73
-
 74
74 -
 75
75 -
 76
76 -
 77
77 -
 78
78 -
 79
79 -
 80
80 -
 81
81 -
 82
82 -
 83
83 -
 84
84 -
 85
85 -
 86
86 -
 87
87 -
 88
88 -
 89
89 -
 90
90 -
 91
91 -
 92
92 -
 93
93 -
 94
94 -
95
-
96
-
97
-
98
-
99
-
100
-
101
-
102
-
103
-
104
-
105
-
106
-
107
-
108
-
109
-
110
-
111
-
112
-
113
-
114
-
115
-
116
-
117
-
118
-
119
-
120
-
121
-
122
-
123
-
124
-
125
-
126
-
127
-
128
-
129
-
130
-
131
-
132
-
133
-
134
-
135
-
136
-
137
-
138
-
139
-
140
-
141
-
142
-
143
-
144
-
145
-
146
-
147
-
148
-
149
-
150
-
151
-
152
-
153
-
154
-
155
-
156
-
157
-
158
-
159
-
160
-
161
-
162
-
163
-
164
-
165
-
166
-
167
-
168
-
169
-
170
-
171
-
172
-
173
-
174
-
175
-
176
-
177
-
178
-
179
-
180
-
181
-
182
-
183
-
184
-
185
-
186
-
187
-
188
-
189
-
190
-
191
-
192
-
193
-
194
-
195
-
196
-
197
-
198
-
199
-
200
-
201
-
202
-
203
-
204
-
205
-
206
-
207
-
208
-
209
-
210
-
211
-
212
-
213
-
214
-
215
-
216
-
217
-
218
-
219
-
220
-
221
-
222
-
223
-
224
-
225
-
226
-
227
-
228
-
229
-
230
-
231
-
232
-
233
-
234
-
235
-
236
-
237
-
238
-
239
-
240
-
241
-
242
-
243
-
244
-
245
-
246
-
247
-
248
-
249
-
250
-
251
-
252
-
253
-
254
-
255
-
256
-
257
-
258
-
259
-
260
-
261
-
262
-
263
-
264
-
265
-
266
-
267
-
268
-
269
-
270
-
271
-
272
-
273
-
274
-
275
-
276
-
277
-
278
-
279
-
280
-
281
-
282
-
283
-
284
 |
 |
EUR 289 million of restructuring charges previously reflected within cost of sales (EUR 173 million), R&D
(EUR 19 million), selling and marketing (EUR 21 million) and administrative expenses (EUR 76 million).
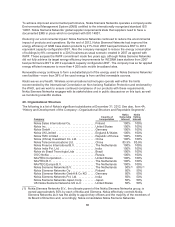
For a description of our organizational structure see Item 4A. “History and Development of the
Company—Organizational Structure and Reportable Segments”. Business segment data in the
following discussion is prior to inter-segment eliminations. See Note 2 to our consolidated financial
statements included in Item 18 of this annual report. The following discussion should be read in
conjunction with our consolidated financial statements included in Item 18 of this annual report,
Item 3D. “Risk Factors” and “Forward-Looking Statements.” Our financial statements have been
prepared in accordance with IFRS.
Principal Factors & Trends Affecting our Results of Operations
Devices & Services
Devices & Services is responsible for developing and managing our portfolio of mobile products, which
we make for all major consumer segments, as well as designing and developing services, including
applications and content, that enrich the experience people have with their mobile devices. Currently,
we are addressing all key geographical markets except Japan. Devices & Services also manages our
supply chain, sales channels, brand and marketing activities and explores corporate strategic and
future growth opportunities for Nokia.
In 2012, the worldwide industry mobile device volumes increased by 2% year-on-year while the market
value in US dollar terms increased by 12%, according to Strategy Analytics. Smartphones continued to
show strong volume and value growth, as well as continued to capture the public focus in the mobile
products market. According to Strategy Analytics, Nokia’s mobile device volume market share was
21% in 2012, compared to 27% in 2011, with the decline primarily driven by market share losses in the
smartphones segment. In 2013, Strategy Analytics forecast that the worldwide industry mobile device
volumes will increase by 6% and the market value in US dollar terms by 7%.
In the following sections, we describe the factors and trends that we believe are currently driving our
Devices & Services net sales and profitability.
Transition and Restructuring
In 2012 our Devices & Services business continued to be in transition, following the announcement of
our partnership with Microsoft in February 2011 where we adopted Windows Phone as our primary
smartphone platform and have phased out the Symbian smartphone platform. We continued to sell
Symbian devices during 2012, with decreasing volumes every quarter due to the deteriorating
competitiveness of our Symbian devices. We do not expect to sell any significant volumes of Symbian
devices in 2013. At the same time, during 2012, we built out our Windows Phone 7 portfolio and
considerably broadened the geographical reach from the initial launch in six Western European
countries. Towards the end of the year we introduced mobile devices based on the new Windows
Phone 8 operating system. We launched the Nokia Lumia 920 and Nokia Lumia 820, our first
smartphones based on the Windows Phone 8 platform, in September 2012 which started shipping to
customers in select markets in November 2012. The Nokia 620, an affordable Windows Phone 8
device, was launched in December 2012 and became available in select markets in January 2013.
In 2012, our Mobile Phones unit continued to introduce new innovations to the market. In June 2012,
we introduced the first full touch device based on the Series 40 operating system, taking the full touch
experience to lower price points. The first new Asha full touch smartphones started shipping at the end
of the second quarter 2012.
In 2012, we announced additional restructuring measures to those announced during 2011 as a result
of our new Devices & Services strategy. We announced in June 2012 that Nokia targets to reduce its
83