Nokia 2012 Annual Report Download - page 107
Download and view the complete annual report
Please find page 107 of the 2012 Nokia annual report below. You can navigate through the pages in the report by either clicking on the pages listed below, or by using the keyword search tool below to find specific information within the annual report.-
 1
1 -
2
-
3
-
4
-
5
-
6
-
7
-
8
-
9
-
10
-
11
-
12
-
13
-
14
-
15
-
16
-
17
-
18
-
19
-
20
-
21
-
22
-
23
-
24
-
25
-
26
-
27
-
28
-
29
-
30
-
31
-
32
-
33
-
34
-
35
-
36
-
37
-
38
-
39
-
40
-
41
-
42
-
43
-
44
-
45
-
46
-
47
-
48
-
49
-
50
-
51
-
52
-
53
-
54
-
55
-
56
-
57
-
58
-
59
-
60
-
61
-
62
-
63
-
64
-
65
-
66
-
67
-
68
-
69
-
70
-
71
-
72
-
73
-
74
-
75
-
76
-
77
-
78
-
79
-
80
-
81
-
82
-
83
-
84
-
85
-
86
-
87
-
88
-
89
-
90
-
91
-
92
-
93
-
94
-
95
-
96
-
 97
97 -
 98
98 -
 99
99 -
 100
100 -
 101
101 -
 102
102 -
 103
103 -
 104
104 -
 105
105 -
 106
106 -
 107
107 -
 108
108 -
 109
109 -
 110
110 -
 111
111 -
 112
112 -
 113
113 -
 114
114 -
 115
115 -
 116
116 -
 117
117 -
118
-
119
-
120
-
121
-
122
-
123
-
124
-
125
-
126
-
127
-
128
-
129
-
130
-
131
-
132
-
133
-
134
-
135
-
136
-
137
-
138
-
139
-
140
-
141
-
142
-
143
-
144
-
145
-
146
-
147
-
148
-
149
-
150
-
151
-
152
-
153
-
154
-
155
-
156
-
157
-
158
-
159
-
160
-
161
-
162
-
163
-
164
-
165
-
166
-
167
-
168
-
169
-
170
-
171
-
172
-
173
-
174
-
175
-
176
-
177
-
178
-
179
-
180
-
181
-
182
-
183
-
184
-
185
-
186
-
187
-
188
-
189
-
190
-
191
-
192
-
193
-
194
-
195
-
196
-
197
-
198
-
199
-
200
-
201
-
202
-
203
-
204
-
205
-
206
-
207
-
208
-
209
-
210
-
211
-
212
-
213
-
214
-
215
-
216
-
217
-
218
-
219
-
220
-
221
-
222
-
223
-
224
-
225
-
226
-
227
-
228
-
229
-
230
-
231
-
232
-
233
-
234
-
235
-
236
-
237
-
238
-
239
-
240
-
241
-
242
-
243
-
244
-
245
-
246
-
247
-
248
-
249
-
250
-
251
-
252
-
253
-
254
-
255
-
256
-
257
-
258
-
259
-
260
-
261
-
262
-
263
-
264
-
265
-
266
-
267
-
268
-
269
-
270
-
271
-
272
-
273
-
274
-
275
-
276
-
277
-
278
-
279
-
280
-
281
-
282
-
283
-
284
 |
 |

account. Significant differences in employee option activity, equity market performance, and our
projected and actual net sales and earnings per share performance may materially affect future
expense. In addition, the value, if any, an employee ultimately receives from share-based payment
awards may not correspond to the expense amounts recorded by the Group.
The Group has also issued certain stock options for the employees of Nokia Siemens Networks, which
are accounted for as cash-settled. Related employee services received, and the liability incurred, are
measured at the fair value of the liability. The fair value of stock options is estimated based on the
reporting date market value less the exercise price of the stock options. The fair value of the liability is
remeasured at each reporting date and at the date of settlement and related change in fair value is
recognized in the income statement over the relevant service periods.
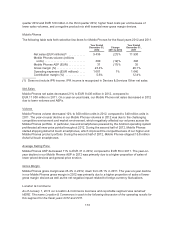
Results of Operations
2012 compared with 2011
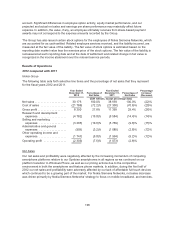
Nokia Group
The following table sets forth selective line items and the percentage of net sales that they represent
for the fiscal years 2012 and 2011.
Year Ended
December 31,
2012
Percentage of
Net Sales
Year Ended
December 31,
2011
Percentage of
Net Sales
Percentage
Increase/
(Decrease)
(EUR millions, except percentage data)
Net sales ..................... 30176 100.0% 38 659 100.0% (22)%
Cost of sales ................. (21786) (72.2)% (27 300) (70.6)% (20)%
Gross profit ................... 8390 27.8% 11 359 29.4% (26)%
Research and development
expenses .................. (4 782) (15.8)% (5 584) (14.4)% (14)%
Selling and marketing
expenses .................. (3 205) (10.6)% (3 769) (9.8)% (15)%
Administrative and general
expenses .................. (959) (3.2)% (1 085) (2.8)% (12)%
Other operating income and
expenses .................. (1 747) (5.8)% (1 994) (5.2)% (12)%
Operating profit ............... (2303) (7.6)% (1 073) (2.8)%
Net Sales
Our net sales and profitability were negatively affected by the increasing momentum of competing
smartphone platforms relative to our Symbian smartphones in all regions as we continued on our
platform transition to Windows Phone, as well as our pricing actions due to the competitive
environment in both the smartphone and feature phone markets. In addition, during the first half of
2012 our net sales and profitability were adversely affected by our lack of affordable full touch devices
which continued to be a growing part of the market. For Nokia Siemens Networks, net sales decrease
was driven primarily by Nokia Siemens Networks’ strategy to focus on mobile broadband, and services.
106