Nokia 2012 Annual Report Download - page 259
Download and view the complete annual report
Please find page 259 of the 2012 Nokia annual report below. You can navigate through the pages in the report by either clicking on the pages listed below, or by using the keyword search tool below to find specific information within the annual report.-
 1
1 -
2
-
3
-
4
-
5
-
6
-
7
-
8
-
9
-
10
-
11
-
12
-
13
-
14
-
15
-
16
-
17
-
18
-
19
-
20
-
21
-
22
-
23
-
24
-
25
-
26
-
27
-
28
-
29
-
30
-
31
-
32
-
33
-
34
-
35
-
36
-
37
-
38
-
39
-
40
-
41
-
42
-
43
-
44
-
45
-
46
-
47
-
48
-
49
-
50
-
51
-
52
-
53
-
54
-
55
-
56
-
57
-
58
-
59
-
60
-
61
-
62
-
63
-
64
-
65
-
66
-
67
-
68
-
69
-
70
-
71
-
72
-
73
-
74
-
75
-
76
-
77
-
78
-
79
-
80
-
81
-
82
-
83
-
84
-
85
-
86
-
87
-
88
-
89
-
90
-
91
-
92
-
93
-
94
-
95
-
96
-
97
-
98
-
99
-
100
-
101
-
102
-
103
-
104
-
105
-
106
-
107
-
108
-
109
-
110
-
111
-
112
-
113
-
114
-
115
-
116
-
117
-
118
-
119
-
120
-
121
-
122
-
123
-
124
-
125
-
126
-
127
-
128
-
129
-
130
-
131
-
132
-
133
-
134
-
135
-
136
-
137
-
138
-
139
-
140
-
141
-
142
-
143
-
144
-
145
-
146
-
147
-
148
-
149
-
150
-
151
-
152
-
153
-
154
-
155
-
156
-
157
-
158
-
159
-
160
-
161
-
162
-
163
-
164
-
165
-
166
-
167
-
168
-
169
-
170
-
171
-
172
-
173
-
174
-
175
-
176
-
177
-
178
-
179
-
180
-
181
-
182
-
183
-
184
-
185
-
186
-
187
-
188
-
189
-
190
-
191
-
192
-
193
-
194
-
195
-
196
-
197
-
198
-
199
-
200
-
201
-
202
-
203
-
204
-
205
-
206
-
207
-
208
-
209
-
210
-
211
-
212
-
213
-
214
-
215
-
216
-
217
-
218
-
219
-
220
-
221
-
222
-
223
-
224
-
225
-
226
-
227
-
228
-
229
-
230
-
231
-
232
-
233
-
234
-
235
-
236
-
237
-
238
-
239
-
240
-
241
-
242
-
243
-
244
-
245
-
246
-
247
-
248
-
 249
249 -
 250
250 -
 251
251 -
 252
252 -
 253
253 -
 254
254 -
 255
255 -
 256
256 -
 257
257 -
 258
258 -
 259
259 -
 260
260 -
 261
261 -
 262
262 -
 263
263 -
 264
264 -
 265
265 -
 266
266 -
 267
267 -
 268
268 -
 269
269 -
270
-
271
-
272
-
273
-
274
-
275
-
276
-
277
-
278
-
279
-
280
-
281
-
282
-
283
-
284
 |
 |

(2) Does not include 698 outstanding performance shares with deferred delivery due to leave of
absence.
(3) Performance Share Plan 2012 has a two-year performance period with an additional one-year
restriction period.
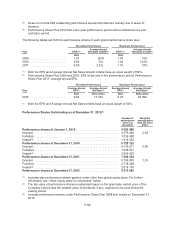
The following tables set forth the performance criteria of each global performance share plan.
Threshold Performance Maximum Performance
Plan EPS(1)(2)
Average Annual
Net Sales Growth(1) EPS(1)(2)
Average Annual
Net Sales Growth(1)
EUR EUR
2009 ....................... 1.01 (5)% 1.53 10%
2010 ....................... 0.82 0% 1.44 13.5%
2011 ....................... 0.50 2.5% 1.10 10%
(1) Both the EPS and Average Annual Net Sales Growth criteria have an equal weight of 50%.
(2) Performance Share Plan 2009 and 2010: EPS at the end of the performance period. Performance
Share Plan 2011: average annual EPS.
Threshold Performance Maximum Performance
Plan
Average Annual
EPS(1)
Average Annual
Net Sales(1)
Average Annual
EPS(1)
Average Annual
Net Sales(1)
EUR EUR million EUR EUR million
2012 ....................... 0.04 17 394 0.35 26 092
(1) Both the EPS and Average Annual Net Sales criteria have an equal weight of 50%.
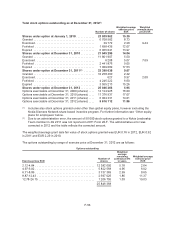
Performance Shares Outstanding as at December 31, 2012(1)
Number of
performance
shares at
threshold
Weighted
average grant
date fair value
EUR(2)
Performance shares at January 1, 2010 ............................ 5 093 960
Granted ........................................................ 3576403 5.94
Forfeited ....................................................... 1039908
Vested(3) ....................................................... 1910332
Performance shares at December 31, 2010 ......................... 5 720 123
Granted ........................................................ 5410211 3.66
Forfeited ....................................................... 1538377
Vested(4) ....................................................... 2009423
Performance shares at December 31, 2011 ......................... 7 582 534
Granted ........................................................ 5785875 1.33
Forfeited ....................................................... 2718208
Vested(5) ....................................................... 2076116
Performance shares at December 31, 2012 ......................... 8 574 085
(1) Includes also performance shares granted under other than global equity plans. For further
information see “Other equity plans for employees” below.
(2) The fair value of performance shares is estimated based on the grant date market price of the
Company’s share less the present value of dividends, if any, expected to be paid during the
vesting period.
(3) Includes performance shares under Performance Share Plan 2008 that vested on December 31,
2010.
F-58