Nokia 2012 Annual Report Download - page 230
Download and view the complete annual report
Please find page 230 of the 2012 Nokia annual report below. You can navigate through the pages in the report by either clicking on the pages listed below, or by using the keyword search tool below to find specific information within the annual report.-
 1
1 -
2
-
3
-
4
-
5
-
6
-
7
-
8
-
9
-
10
-
11
-
12
-
13
-
14
-
15
-
16
-
17
-
18
-
19
-
20
-
21
-
22
-
23
-
24
-
25
-
26
-
27
-
28
-
29
-
30
-
31
-
32
-
33
-
34
-
35
-
36
-
37
-
38
-
39
-
40
-
41
-
42
-
43
-
44
-
45
-
46
-
47
-
48
-
49
-
50
-
51
-
52
-
53
-
54
-
55
-
56
-
57
-
58
-
59
-
60
-
61
-
62
-
63
-
64
-
65
-
66
-
67
-
68
-
69
-
70
-
71
-
72
-
73
-
74
-
75
-
76
-
77
-
78
-
79
-
80
-
81
-
82
-
83
-
84
-
85
-
86
-
87
-
88
-
89
-
90
-
91
-
92
-
93
-
94
-
95
-
96
-
97
-
98
-
99
-
100
-
101
-
102
-
103
-
104
-
105
-
106
-
107
-
108
-
109
-
110
-
111
-
112
-
113
-
114
-
115
-
116
-
117
-
118
-
119
-
120
-
121
-
122
-
123
-
124
-
125
-
126
-
127
-
128
-
129
-
130
-
131
-
132
-
133
-
134
-
135
-
136
-
137
-
138
-
139
-
140
-
141
-
142
-
143
-
144
-
145
-
146
-
147
-
148
-
149
-
150
-
151
-
152
-
153
-
154
-
155
-
156
-
157
-
158
-
159
-
160
-
161
-
162
-
163
-
164
-
165
-
166
-
167
-
168
-
169
-
170
-
171
-
172
-
173
-
174
-
175
-
176
-
177
-
178
-
179
-
180
-
181
-
182
-
183
-
184
-
185
-
186
-
187
-
188
-
189
-
190
-
191
-
192
-
193
-
194
-
195
-
196
-
197
-
198
-
199
-
200
-
201
-
202
-
203
-
204
-
205
-
206
-
207
-
208
-
209
-
210
-
211
-
212
-
213
-
214
-
215
-
216
-
217
-
218
-
219
-
 220
220 -
 221
221 -
 222
222 -
 223
223 -
 224
224 -
 225
225 -
 226
226 -
 227
227 -
 228
228 -
 229
229 -
 230
230 -
 231
231 -
 232
232 -
 233
233 -
 234
234 -
 235
235 -
 236
236 -
 237
237 -
 238
238 -
 239
239 -
 240
240 -
241
-
242
-
243
-
244
-
245
-
246
-
247
-
248
-
249
-
250
-
251
-
252
-
253
-
254
-
255
-
256
-
257
-
258
-
259
-
260
-
261
-
262
-
263
-
264
-
265
-
266
-
267
-
268
-
269
-
270
-
271
-
272
-
273
-
274
-
275
-
276
-
277
-
278
-
279
-
280
-
281
-
282
-
283
-
284
 |
 |

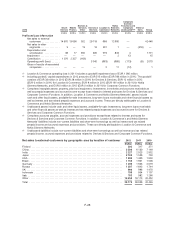
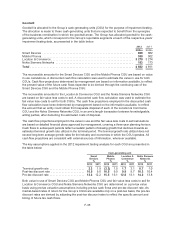
Segment non-current assets by geographic area(7) 2012 2011
EURm EURm
Finland ........................................................................ 1 662 1 651
China ......................................................................... 387 472
India .......................................................................... 151 185
Brazil ......................................................................... 77 83
UK ........................................................................... 175 212
USA .......................................................................... 4 166 4 757
Other ......................................................................... 336 732
Total .......................................................................... 6 954 8 092
(7) Comprises intangible and tangible assets and property, plant and equipment
3. Percentage of completion
Contract sales recognized under percentage of completion accounting are EUR 3 431 million in 2012
(EUR 4 769 million in 2011 and EUR 5 094 million in 2010). Service revenue for managed services and
network maintenance contracts are EUR 2 655 million in 2012 (EUR 2 994 million in 2011 and
EUR 2 924 million in 2010).
Advances received related to construction contracts, included in accrued expenses and other liabilities,
are EUR 58 million at December 31, 2012 (EUR 95 million in 2011). Included in accounts receivable are
contract revenues recorded prior to billings EUR 700 million at December 31, 2012 (EUR 1 267 million in
2011) and billings in excess of costs incurred are EUR 216 million at December 31, 2012
(EUR 260 million in 2011).
The aggregate amount of costs incurred and recognized profits (net of recognized losses) under
construction contracts in progress since inception is EUR 18 107 million at December 31, 2012
(EUR 20 077 million in 2011).
Retentions related to construction contracts, included in accounts receivable, are EUR 100 million at
December 31, 2012 (EUR 136 million at December 31, 2011).
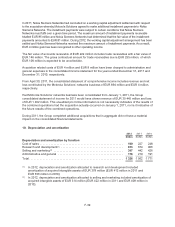
4. Personnel expenses
2012 2011 2010
EURm EURm EURm
Wages and salaries ................................................. 6 080 6 284 5 808
Share-based compensation expense, total .............................. 13 18 48
Pension expenses, net ............................................... 375 445 431
Other social expenses ............................................... 715 787 708
Personnel expenses as per income statement(1) .......................... 7 183 7 534 6 995
(1) Include termination benefits
Share-based compensation expense includes pension and other social costs of EUR 0 million in 2012
(EUR 0 million in 2011 and EUR 1 million in 2010) based upon the related employee benefit charge
recognized during the year.
Pension expenses, comprised of multi-employer, insured and defined contribution plans were
EUR 335 million in 2012 (EUR 396 million in 2011 and EUR 377 million in 2010). The remainder
consists of expenses related to defined benefit plans.
F-29