Nokia 2012 Annual Report Download - page 236
Download and view the complete annual report
Please find page 236 of the 2012 Nokia annual report below. You can navigate through the pages in the report by either clicking on the pages listed below, or by using the keyword search tool below to find specific information within the annual report.-
 1
1 -
2
-
3
-
4
-
5
-
6
-
7
-
8
-
9
-
10
-
11
-
12
-
13
-
14
-
15
-
16
-
17
-
18
-
19
-
20
-
21
-
22
-
23
-
24
-
25
-
26
-
27
-
28
-
29
-
30
-
31
-
32
-
33
-
34
-
35
-
36
-
37
-
38
-
39
-
40
-
41
-
42
-
43
-
44
-
45
-
46
-
47
-
48
-
49
-
50
-
51
-
52
-
53
-
54
-
55
-
56
-
57
-
58
-
59
-
60
-
61
-
62
-
63
-
64
-
65
-
66
-
67
-
68
-
69
-
70
-
71
-
72
-
73
-
74
-
75
-
76
-
77
-
78
-
79
-
80
-
81
-
82
-
83
-
84
-
85
-
86
-
87
-
88
-
89
-
90
-
91
-
92
-
93
-
94
-
95
-
96
-
97
-
98
-
99
-
100
-
101
-
102
-
103
-
104
-
105
-
106
-
107
-
108
-
109
-
110
-
111
-
112
-
113
-
114
-
115
-
116
-
117
-
118
-
119
-
120
-
121
-
122
-
123
-
124
-
125
-
126
-
127
-
128
-
129
-
130
-
131
-
132
-
133
-
134
-
135
-
136
-
137
-
138
-
139
-
140
-
141
-
142
-
143
-
144
-
145
-
146
-
147
-
148
-
149
-
150
-
151
-
152
-
153
-
154
-
155
-
156
-
157
-
158
-
159
-
160
-
161
-
162
-
163
-
164
-
165
-
166
-
167
-
168
-
169
-
170
-
171
-
172
-
173
-
174
-
175
-
176
-
177
-
178
-
179
-
180
-
181
-
182
-
183
-
184
-
185
-
186
-
187
-
188
-
189
-
190
-
191
-
192
-
193
-
194
-
195
-
196
-
197
-
198
-
199
-
200
-
201
-
202
-
203
-
204
-
205
-
206
-
207
-
208
-
209
-
210
-
211
-
212
-
213
-
214
-
215
-
216
-
217
-
218
-
219
-
220
-
221
-
222
-
223
-
224
-
225
-
 226
226 -
 227
227 -
 228
228 -
 229
229 -
 230
230 -
 231
231 -
 232
232 -
 233
233 -
 234
234 -
 235
235 -
 236
236 -
 237
237 -
 238
238 -
 239
239 -
 240
240 -
 241
241 -
 242
242 -
 243
243 -
 244
244 -
 245
245 -
 246
246 -
247
-
248
-
249
-
250
-
251
-
252
-
253
-
254
-
255
-
256
-
257
-
258
-
259
-
260
-
261
-
262
-
263
-
264
-
265
-
266
-
267
-
268
-
269
-
270
-
271
-
272
-
273
-
274
-
275
-
276
-
277
-
278
-
279
-
280
-
281
-
282
-
283
-
284
 |
 |

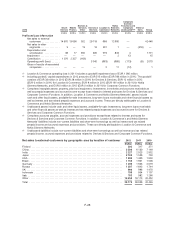
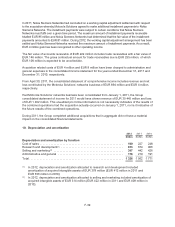
Goodwill
Goodwill is allocated to the Group’s cash-generating units (CGU) for the purpose of impairment testing.
The allocation is made to those cash-generating units that are expected to benefit from the synergies
of the business combination in which the goodwill arose. The Group has allocated goodwill to the cash-
generating units, which correspond to the Group’s reportable segments at each of the respective years’
impairment testing date, as presented in the table below:
2012 2011
EURm EURm
Smart Devices ............................................................ 899 862
Mobile Phones ............................................................ 530 502
Location & Commerce ...................................................... 3 270 3 274
Nokia Siemens Networks ................................................... 183 173
Total .................................................................... 4 882 4 811
The recoverable amounts for the Smart Devices CGU and the Mobile Phones CGU are based on value
in use calculations. A discounted cash flow calculation was used to estimate the value in use for both
CGUs. Cash flow projections determined by management are based on information available, to reflect
the present value of the future cash flows expected to be derived through the continuing use of the
Smart Devices CGU and the Mobile Phones CGU.
The recoverable amounts for the Location & Commerce CGU and the Nokia Siemens Networks CGU
are based on fair value less costs to sell. A discounted cash flow calculation was used to estimate the
fair value less costs to sell for both CGUs. The cash flow projections employed in the discounted cash
flow calculation have been determined by management based on the information available, to reflect
the amount that an entity could obtain from separate disposal of each of the Location & Commerce
CGU and the Nokia Siemens Networks CGU, in an arm’s length transaction between knowledgeable,
willing parties, after deducting the estimated costs of disposal.
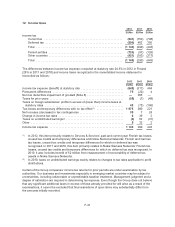
The cash flow projections employed in the value in use and the fair value less costs to sell calculations
are based on detailed financial plans approved by management, covering a three-year planning horizon.
Cash flows in subsequent periods reflect a realistic pattern of slowing growth that declines towards an
estimated terminal growth rate utilized in the terminal period. The terminal growth rate utilized does not
exceed long-term average growth rates for the industry and economies in which the CGU operates. All
cash flow projections are consistent with external sources of information, wherever available.
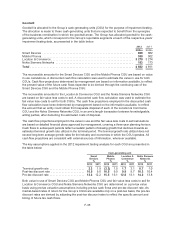
The key assumptions applied in the 2012 impairment testing analysis for each CGU are presented in
the table below:
Cash-generating unit
Smart
Devices
%
Mobile
Phones
%
Location &
Commerce
%
Nokia Siemens
Networks
%
2012 2011 2012 2011 2012 2011 2012 2011
Terminal growth rate ....................... 2.3 1.9 (2.3) 1.5 1.7 3.1 0.7 1.0
Post-tax discount rate ...................... 10.5 9.0 10.5 9.0 9.9 9.7 10.3 10.4
Pre-tax discount rate ....................... 12.8 12.2 15.5 13.1 12.8 13.1 14.2 13.8
Both value in use of Smart Devices CGU and Mobile Phones CGU and fair value less costs to sell for
Location & Commerce CGU and Nokia Siemens Networks CGU are determined on a pre-tax value
basis using pre-tax valuation assumptions including pre-tax cash flows and pre-tax discount rate. As
market-based rates of return for the Group’s CGUs are available only on a post-tax basis, the pre-tax
discount rates are derived by adjusting the post-tax discount rates to reflect the specific amount and
timing of future tax cash flows.
F-35