Nokia 2012 Annual Report Download - page 260
Download and view the complete annual report
Please find page 260 of the 2012 Nokia annual report below. You can navigate through the pages in the report by either clicking on the pages listed below, or by using the keyword search tool below to find specific information within the annual report.-
 1
1 -
2
-
3
-
4
-
5
-
6
-
7
-
8
-
9
-
10
-
11
-
12
-
13
-
14
-
15
-
16
-
17
-
18
-
19
-
20
-
21
-
22
-
23
-
24
-
25
-
26
-
27
-
28
-
29
-
30
-
31
-
32
-
33
-
34
-
35
-
36
-
37
-
38
-
39
-
40
-
41
-
42
-
43
-
44
-
45
-
46
-
47
-
48
-
49
-
50
-
51
-
52
-
53
-
54
-
55
-
56
-
57
-
58
-
59
-
60
-
61
-
62
-
63
-
64
-
65
-
66
-
67
-
68
-
69
-
70
-
71
-
72
-
73
-
74
-
75
-
76
-
77
-
78
-
79
-
80
-
81
-
82
-
83
-
84
-
85
-
86
-
87
-
88
-
89
-
90
-
91
-
92
-
93
-
94
-
95
-
96
-
97
-
98
-
99
-
100
-
101
-
102
-
103
-
104
-
105
-
106
-
107
-
108
-
109
-
110
-
111
-
112
-
113
-
114
-
115
-
116
-
117
-
118
-
119
-
120
-
121
-
122
-
123
-
124
-
125
-
126
-
127
-
128
-
129
-
130
-
131
-
132
-
133
-
134
-
135
-
136
-
137
-
138
-
139
-
140
-
141
-
142
-
143
-
144
-
145
-
146
-
147
-
148
-
149
-
150
-
151
-
152
-
153
-
154
-
155
-
156
-
157
-
158
-
159
-
160
-
161
-
162
-
163
-
164
-
165
-
166
-
167
-
168
-
169
-
170
-
171
-
172
-
173
-
174
-
175
-
176
-
177
-
178
-
179
-
180
-
181
-
182
-
183
-
184
-
185
-
186
-
187
-
188
-
189
-
190
-
191
-
192
-
193
-
194
-
195
-
196
-
197
-
198
-
199
-
200
-
201
-
202
-
203
-
204
-
205
-
206
-
207
-
208
-
209
-
210
-
211
-
212
-
213
-
214
-
215
-
216
-
217
-
218
-
219
-
220
-
221
-
222
-
223
-
224
-
225
-
226
-
227
-
228
-
229
-
230
-
231
-
232
-
233
-
234
-
235
-
236
-
237
-
238
-
239
-
240
-
241
-
242
-
243
-
244
-
245
-
246
-
247
-
248
-
249
-
 250
250 -
 251
251 -
 252
252 -
 253
253 -
 254
254 -
 255
255 -
 256
256 -
 257
257 -
 258
258 -
 259
259 -
 260
260 -
 261
261 -
 262
262 -
 263
263 -
 264
264 -
 265
265 -
 266
266 -
 267
267 -
 268
268 -
 269
269 -
 270
270 -
271
-
272
-
273
-
274
-
275
-
276
-
277
-
278
-
279
-
280
-
281
-
282
-
283
-
284
 |
 |

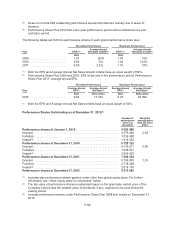
(4) Includes performance shares under Performance Share plan 2009 that vested on December 31,
2011.
(5) Includes performance shares under Performance Share plan 2010 that vested on December 31,
2012. Includes shares receivable through the one-time special CEO incentive program that vested
on December 31, 2012.
There was no settlement under the Performance Share Plan 2010 as neither of the threshold
performance criteria of EPS and Average Annual Net Sales Growth of this plan was met.
There was no settlement under the one-time special CEO incentive program as the performance
criteria were not met.
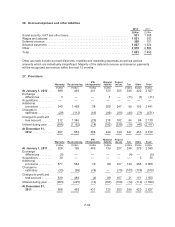
Restricted shares
During 2012, Nokia administered four global restricted share plans, the Restricted Share Plans 2009,
2010, 2011 and 2012, each of which, including its terms and conditions, has been approved by the
Board of Directors.
Restricted Shares are used on a selective basis to ensure retention and recruitment of individuals with
functional mastery and other employees deemed critical to Nokia’s future success.
All of the Group’s restricted share plans have a restriction period of three years after grant. Until the
Nokia shares are delivered, the participants will not have any shareholder rights, such as voting or
dividend rights, associated with the restricted shares. The restricted share grants are generally
forfeited if the employment relationship terminates with Nokia prior to vesting.
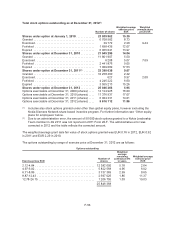
Restricted Shares Outstanding as at December 31, 2012(1)
Number of
Restricted
Shares
Weighted
average grant
date fair value
EUR(2)
Restricted Shares at January 1, 2010 ............................. 9 381 002
Granted ....................................................... 5801800 6.85
Forfeited ....................................................... 1492357
Vested ........................................................ 1330549
Restricted Shares at December 31, 2010 .......................... 12 359 896
Granted ....................................................... 8024880 3.15
Forfeited ....................................................... 2063518
Vested ........................................................ 1735167
Restricted Shares at December 31, 2011(3) ......................... 16 586 091
Granted ....................................................... 12999131 1.76
Forfeited ....................................................... 4580182
Vested ........................................................ 1324508
Restricted Shares at December 31, 2012(4) ......................... 23 680 532
(1) Includes also restricted shares granted under other than global equity plans. For further
information see “Other equity plans for employees” below.
(2) The fair value of restricted shares is estimated based on the grant date market price of the
Company’s share less the present value of dividends, if any, expected to be paid during the
vesting period.
(3) Includes 901 900 restricted shares granted in Q4 2008 under Restricted Share Plan 2008 that
vested on January 1, 2012.
(4) Includes 1 960 700 restricted shares granted in Q4 2009 under Restricted Share Plan 2009 that
vested on January 1, 2013.
F-59