Nokia 2012 Annual Report Download - page 114
Download and view the complete annual report
Please find page 114 of the 2012 Nokia annual report below. You can navigate through the pages in the report by either clicking on the pages listed below, or by using the keyword search tool below to find specific information within the annual report.-
 1
1 -
2
-
3
-
4
-
5
-
6
-
7
-
8
-
9
-
10
-
11
-
12
-
13
-
14
-
15
-
16
-
17
-
18
-
19
-
20
-
21
-
22
-
23
-
24
-
25
-
26
-
27
-
28
-
29
-
30
-
31
-
32
-
33
-
34
-
35
-
36
-
37
-
38
-
39
-
40
-
41
-
42
-
43
-
44
-
45
-
46
-
47
-
48
-
49
-
50
-
51
-
52
-
53
-
54
-
55
-
56
-
57
-
58
-
59
-
60
-
61
-
62
-
63
-
64
-
65
-
66
-
67
-
68
-
69
-
70
-
71
-
72
-
73
-
74
-
75
-
76
-
77
-
78
-
79
-
80
-
81
-
82
-
83
-
84
-
85
-
86
-
87
-
88
-
89
-
90
-
91
-
92
-
93
-
94
-
95
-
96
-
97
-
98
-
99
-
100
-
101
-
102
-
103
-
 104
104 -
 105
105 -
 106
106 -
 107
107 -
 108
108 -
 109
109 -
 110
110 -
 111
111 -
 112
112 -
 113
113 -
 114
114 -
 115
115 -
 116
116 -
 117
117 -
 118
118 -
 119
119 -
 120
120 -
 121
121 -
 122
122 -
 123
123 -
 124
124 -
125
-
126
-
127
-
128
-
129
-
130
-
131
-
132
-
133
-
134
-
135
-
136
-
137
-
138
-
139
-
140
-
141
-
142
-
143
-
144
-
145
-
146
-
147
-
148
-
149
-
150
-
151
-
152
-
153
-
154
-
155
-
156
-
157
-
158
-
159
-
160
-
161
-
162
-
163
-
164
-
165
-
166
-
167
-
168
-
169
-
170
-
171
-
172
-
173
-
174
-
175
-
176
-
177
-
178
-
179
-
180
-
181
-
182
-
183
-
184
-
185
-
186
-
187
-
188
-
189
-
190
-
191
-
192
-
193
-
194
-
195
-
196
-
197
-
198
-
199
-
200
-
201
-
202
-
203
-
204
-
205
-
206
-
207
-
208
-
209
-
210
-
211
-
212
-
213
-
214
-
215
-
216
-
217
-
218
-
219
-
220
-
221
-
222
-
223
-
224
-
225
-
226
-
227
-
228
-
229
-
230
-
231
-
232
-
233
-
234
-
235
-
236
-
237
-
238
-
239
-
240
-
241
-
242
-
243
-
244
-
245
-
246
-
247
-
248
-
249
-
250
-
251
-
252
-
253
-
254
-
255
-
256
-
257
-
258
-
259
-
260
-
261
-
262
-
263
-
264
-
265
-
266
-
267
-
268
-
269
-
270
-
271
-
272
-
273
-
274
-
275
-
276
-
277
-
278
-
279
-
280
-
281
-
282
-
283
-
284
 |
 |

quarter 2012 and EUR 120 million in the third quarter 2012, higher fixed costs per unit because of
lower sales volumes, and a negative product mix shift towards lower gross margin devices.
Mobile Phones
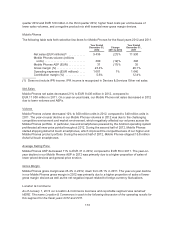
The following table sets forth selective line items for Mobile Phones for the fiscal years 2012 and 2011.
Year Ended
December 31,
2012
Change
2011 to 2012
Year Ended
December 31,
2011
Net sales (EUR millions)(1) ........... 9436 (21)% 11 930
Mobile Phones volume (millions
units) ........................... 300 (12)% 340
Mobile Phones ASP (EUR) ........... 31 (11)% 35
Gross margin (%) ................... 23.4% 26.1%
Operating expenses (EUR millions) .... 1661 1% 1640
Contribution margin (%) ............. 5.6% 12.4%
(1) Does not include IPR income. IPR income is recognized in Devices & Services Other net sales.
Net Sales
Mobile Phones net sales decreased 21% to EUR 9 436 million in 2012, compared to
EUR 11 930 million in 2011. On a year-on-year basis, our Mobile Phones net sales decreased in 2012
due to lower volumes and ASPs.
Volume
Mobile Phones volume decreased 12% to 300 million units in 2012, compared to 340 million units in
2011. The year-on-year decline in our Mobile Phones volumes in 2012 was due to the challenging
competitive environment and market environment, which negatively affected our volumes across the
Mobile Phones portfolio. In particular, low-end smartphones powered by the Android operating system
proliferated at lower price points throughout 2012. During the second half of 2012, Mobile Phones
started shipping Asha full touch smartphones, which improved the competitiveness of our higher end
Mobile Phones product portfolio. During the second half of 2012, Mobile Phones shipped 15.8 million
Asha full touch smartphones.
Average Selling Price
Mobile Phones ASP decreased 11% to EUR 31 in 2012, compared to EUR 35 in 2011. The year-on-
year decline in our Mobile Phones ASP in 2012 was primarily due to a higher proportion of sales of
lower priced devices and general price erosion.
Gross Margin
Mobile Phones gross margin was 23.4% in 2012, down from 26.1% in 2011. The year-on-year decline
in our Mobile Phones gross margin in 2012 was primarily due to a higher proportion of sales of lower
gross margin devices as well as the net negative impact related to foreign currency fluctuations.
Location & Commerce
As of January 1, 2013 our Location & Commerce business and reportable segment was renamed
HERE. The name Location & Commerce is used in the following discussion of the operating results for
this segment for the fiscal years 2012 and 2011.
113