Nokia 2012 Annual Report Download - page 172
Download and view the complete annual report
Please find page 172 of the 2012 Nokia annual report below. You can navigate through the pages in the report by either clicking on the pages listed below, or by using the keyword search tool below to find specific information within the annual report.-
 1
1 -
2
-
3
-
4
-
5
-
6
-
7
-
8
-
9
-
10
-
11
-
12
-
13
-
14
-
15
-
16
-
17
-
18
-
19
-
20
-
21
-
22
-
23
-
24
-
25
-
26
-
27
-
28
-
29
-
30
-
31
-
32
-
33
-
34
-
35
-
36
-
37
-
38
-
39
-
40
-
41
-
42
-
43
-
44
-
45
-
46
-
47
-
48
-
49
-
50
-
51
-
52
-
53
-
54
-
55
-
56
-
57
-
58
-
59
-
60
-
61
-
62
-
63
-
64
-
65
-
66
-
67
-
68
-
69
-
70
-
71
-
72
-
73
-
74
-
75
-
76
-
77
-
78
-
79
-
80
-
81
-
82
-
83
-
84
-
85
-
86
-
87
-
88
-
89
-
90
-
91
-
92
-
93
-
94
-
95
-
96
-
97
-
98
-
99
-
100
-
101
-
102
-
103
-
104
-
105
-
106
-
107
-
108
-
109
-
110
-
111
-
112
-
113
-
114
-
115
-
116
-
117
-
118
-
119
-
120
-
121
-
122
-
123
-
124
-
125
-
126
-
127
-
128
-
129
-
130
-
131
-
132
-
133
-
134
-
135
-
136
-
137
-
138
-
139
-
140
-
141
-
142
-
143
-
144
-
145
-
146
-
147
-
148
-
149
-
150
-
151
-
152
-
153
-
154
-
155
-
156
-
157
-
158
-
159
-
160
-
161
-
 162
162 -
 163
163 -
 164
164 -
 165
165 -
 166
166 -
 167
167 -
 168
168 -
 169
169 -
 170
170 -
 171
171 -
 172
172 -
 173
173 -
 174
174 -
 175
175 -
 176
176 -
 177
177 -
 178
178 -
 179
179 -
 180
180 -
 181
181 -
 182
182 -
183
-
184
-
185
-
186
-
187
-
188
-
189
-
190
-
191
-
192
-
193
-
194
-
195
-
196
-
197
-
198
-
199
-
200
-
201
-
202
-
203
-
204
-
205
-
206
-
207
-
208
-
209
-
210
-
211
-
212
-
213
-
214
-
215
-
216
-
217
-
218
-
219
-
220
-
221
-
222
-
223
-
224
-
225
-
226
-
227
-
228
-
229
-
230
-
231
-
232
-
233
-
234
-
235
-
236
-
237
-
238
-
239
-
240
-
241
-
242
-
243
-
244
-
245
-
246
-
247
-
248
-
249
-
250
-
251
-
252
-
253
-
254
-
255
-
256
-
257
-
258
-
259
-
260
-
261
-
262
-
263
-
264
-
265
-
266
-
267
-
268
-
269
-
270
-
271
-
272
-
273
-
274
-
275
-
276
-
277
-
278
-
279
-
280
-
281
-
282
-
283
-
284
 |
 |

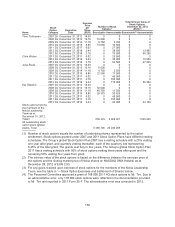
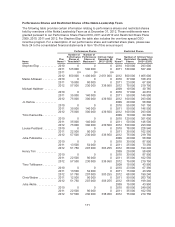
Performance Shares and Restricted Shares of the Nokia Leadership Team
The following table provides certain information relating to performance shares and restricted shares
held by members of the Nokia Leadership Team as at December 31, 2012. These entitlements were
granted pursuant to our Performance Share Plans 2010, 2011 and 2012 and Restricted Share Plans
2009, 2010, 2011 and 2012. For Stephen Elop the table also includes the one-time special CEO
incentive program. For a description of our performance share and restricted share plans, please see
Note 24 to the consolidated financial statements in Item 18 of this annual report.
Performance Shares Restricted Shares
Name
Plan
Name(1)
Number of
Performance
Shares at
Threshold(2)
Number of
Performance
Shares at
Maximum(3)
Intrinsic Value
December 28,
2012(5) (EUR)
Plan
Name(7)
Number of
Restricted
Shares
Intrinsic Value
December 28,
2012(8) (EUR)
Stephen Elop ........... 2010 0 0 0 2010 100 000 293 000
2011 125 000 500 000 0 2011 180 000 527 400
2011 0(4) 0(4) 0(6)
2012 350 000 1 400 000 2 051 000 2012 500 000 1 465 000
Marko Ahtisaari ......... 2010 0 0 0 2010 37 000 108 410
2011 15 000 60 000 0 2011 23 000 67 390
2012 57 500 230 000 336 950 2012 75 000 219 750
Michael Halbherr ........ 2009 10 500 30 765
2010 0 0 0 2010 17 000 49 810
2011 35 000 140 000 0 2011 50 000 146 500
2012 75 000 300 000 439 500 2012 100 000 293 000
Jo Harlow .............. 2009 20 000 58 600
2010 0 0 0 2010 55 000 161 150
2011 35 000 140 000 0 2011 50 000 146 500
2012 75 000 300 000 439 500 2012 100 000 293 000
Timo Ihamuotila ......... 2009 10 000 29 300
2010 0 0 0 2010 120 000 351 600
2011 35 000 140 000 0 2011 50 000 146 500
2012 75 000 300 000 439 500 2012 100 000 293 000
Louise Pentland ......... 2010 0 0 0 2010 78 000 228 540
2011 22 500 90 000 0 2011 35 000 102 550
2012 57 500 230 000 336 950 2012 75 000 219 750
Juha Putkiranta ......... 2009 20 000 58 600
2010 0 0 0 2010 30 000 87 900
2011 13 500 54 000 0 2011 25 000 73 250
2012 51 750 207 000 303 255 2012 68 000 199 240
Henry Tirri ............. 2009 20 000 58 600
2010 0 0 0 2010 30 000 87 900
2011 22 500 90 000 0 2011 35 000 102 550
2012 57 500 230 000 336 950 2012 75 000 219 750
Timo Toikkanen ......... 2009 15 000 43 950
2010 0 0 0 2010 23 000 67 390
2011 13 500 54 000 0 2011 15 000 43 950
2012 51 750 207 000 303 255 2012 68 000 199 240
Chris Weber ............ 2011 12 500 50 000 0 2011 90 000 263 700
2012 51 750 207 000 303 255 2012 68 000 199 240
Juha Äkräs ............. 2009 15 000 43 950
2010 0 0 0 2010 85 000 249 050
2011 22 500 90 000 0 2011 35 000 102 550
2012 57 500 230 000 336 950 2012 75 000 219 750
171