Nokia 2012 Annual Report Download - page 275
Download and view the complete annual report
Please find page 275 of the 2012 Nokia annual report below. You can navigate through the pages in the report by either clicking on the pages listed below, or by using the keyword search tool below to find specific information within the annual report.-
 1
1 -
2
-
3
-
4
-
5
-
6
-
7
-
8
-
9
-
10
-
11
-
12
-
13
-
14
-
15
-
16
-
17
-
18
-
19
-
20
-
21
-
22
-
23
-
24
-
25
-
26
-
27
-
28
-
29
-
30
-
31
-
32
-
33
-
34
-
35
-
36
-
37
-
38
-
39
-
40
-
41
-
42
-
43
-
44
-
45
-
46
-
47
-
48
-
49
-
50
-
51
-
52
-
53
-
54
-
55
-
56
-
57
-
58
-
59
-
60
-
61
-
62
-
63
-
64
-
65
-
66
-
67
-
68
-
69
-
70
-
71
-
72
-
73
-
74
-
75
-
76
-
77
-
78
-
79
-
80
-
81
-
82
-
83
-
84
-
85
-
86
-
87
-
88
-
89
-
90
-
91
-
92
-
93
-
94
-
95
-
96
-
97
-
98
-
99
-
100
-
101
-
102
-
103
-
104
-
105
-
106
-
107
-
108
-
109
-
110
-
111
-
112
-
113
-
114
-
115
-
116
-
117
-
118
-
119
-
120
-
121
-
122
-
123
-
124
-
125
-
126
-
127
-
128
-
129
-
130
-
131
-
132
-
133
-
134
-
135
-
136
-
137
-
138
-
139
-
140
-
141
-
142
-
143
-
144
-
145
-
146
-
147
-
148
-
149
-
150
-
151
-
152
-
153
-
154
-
155
-
156
-
157
-
158
-
159
-
160
-
161
-
162
-
163
-
164
-
165
-
166
-
167
-
168
-
169
-
170
-
171
-
172
-
173
-
174
-
175
-
176
-
177
-
178
-
179
-
180
-
181
-
182
-
183
-
184
-
185
-
186
-
187
-
188
-
189
-
190
-
191
-
192
-
193
-
194
-
195
-
196
-
197
-
198
-
199
-
200
-
201
-
202
-
203
-
204
-
205
-
206
-
207
-
208
-
209
-
210
-
211
-
212
-
213
-
214
-
215
-
216
-
217
-
218
-
219
-
220
-
221
-
222
-
223
-
224
-
225
-
226
-
227
-
228
-
229
-
230
-
231
-
232
-
233
-
234
-
235
-
236
-
237
-
238
-
239
-
240
-
241
-
242
-
243
-
244
-
245
-
246
-
247
-
248
-
249
-
250
-
251
-
252
-
253
-
254
-
255
-
256
-
257
-
258
-
259
-
260
-
261
-
262
-
263
-
264
-
 265
265 -
 266
266 -
 267
267 -
 268
268 -
 269
269 -
 270
270 -
 271
271 -
 272
272 -
 273
273 -
 274
274 -
 275
275 -
 276
276 -
 277
277 -
 278
278 -
 279
279 -
 280
280 -
 281
281 -
 282
282 -
 283
283 -
 284
284
 |
 |

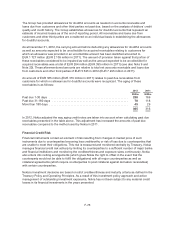
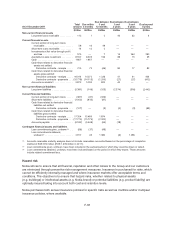
The VaR figures for the Group’s financial instruments which are sensitive to foreign exchange risks are
presented in the table below. The VaR calculation includes foreign currency denominated monetary
financial instruments such as:
• Available-for-sale investments, loans and accounts receivables, investments at fair value
through profit and loss, cash, loans and accounts payable.
• FX derivatives carried at fair value through profit and loss which are not in a hedge
relationship and are mostly used for hedging balance sheet FX exposure.
• FX derivatives designated as forecasted cash flow hedges and net investment hedges. Most
of the VaR is caused by these derivatives as forecasted cash flow and net investment
exposures are not financial instruments as defined under IFRS 7 and thus not included in the
VaR calculation.
VaR from financial
instruments
2012 2011
EURm EURm
At December 31 ..................................................... 67 141
Average for the year .................................................. 128 218
Range for the year ................................................... 67 - 192 141 - 316
Interest rate risk
The Group is exposed to interest rate risk either through market value fluctuations of balance sheet
items (i.e. price risk) or through changes in interest income or expenses (i.e. refinancing or
reinvestment risk). Interest rate risk mainly arises through interest bearing liabilities and assets.
Estimated future changes in cash flows and balance sheet structure also expose the Group to interest
rate risk.
The objective of interest rate risk management is to balance uncertainty caused by fluctuations in
interest rates and net long-term funding costs.
At the reporting date, the interest rate profile of the Group’s interest-bearing assets and liabilities is
presented in the table below:
2012 2011
Fixed rate Floating rate Fixed rate Floating rate
EURm EURm EURm EURm
Assets ........................................ 3 488 6 627 6 384 4 733
Liabilities ...................................... (4 191) (1 312) (4 313) (950)
Assets and liabilities before derivatives ............. (703) 5 315 2 071 3 783
Interest rate derivatives .......................... 1 880 (1 784) 1 736 (1 656)
Assets and liabilities after derivatives ............... 1 177 3 531 3 807 2 127
The interest rate exposure of the Group is monitored and managed centrally. Nokia uses the
Value-at-Risk (VaR) methodology complemented by selective shock sensitivity analyses to assess and
measure the interest rate risk of interest-bearing assets, interest-bearing liabilities and related
derivatives, which together create the Group’s interest rate exposure. The VaR for the Group interest
rate exposure in the investment and debt portfolios is presented in the table below. Sensitivities to
credit spreads are not reflected in the below numbers.
F-74