Nokia 2012 Annual Report Download - page 247
Download and view the complete annual report
Please find page 247 of the 2012 Nokia annual report below. You can navigate through the pages in the report by either clicking on the pages listed below, or by using the keyword search tool below to find specific information within the annual report.-
 1
1 -
2
-
3
-
4
-
5
-
6
-
7
-
8
-
9
-
10
-
11
-
12
-
13
-
14
-
15
-
16
-
17
-
18
-
19
-
20
-
21
-
22
-
23
-
24
-
25
-
26
-
27
-
28
-
29
-
30
-
31
-
32
-
33
-
34
-
35
-
36
-
37
-
38
-
39
-
40
-
41
-
42
-
43
-
44
-
45
-
46
-
47
-
48
-
49
-
50
-
51
-
52
-
53
-
54
-
55
-
56
-
57
-
58
-
59
-
60
-
61
-
62
-
63
-
64
-
65
-
66
-
67
-
68
-
69
-
70
-
71
-
72
-
73
-
74
-
75
-
76
-
77
-
78
-
79
-
80
-
81
-
82
-
83
-
84
-
85
-
86
-
87
-
88
-
89
-
90
-
91
-
92
-
93
-
94
-
95
-
96
-
97
-
98
-
99
-
100
-
101
-
102
-
103
-
104
-
105
-
106
-
107
-
108
-
109
-
110
-
111
-
112
-
113
-
114
-
115
-
116
-
117
-
118
-
119
-
120
-
121
-
122
-
123
-
124
-
125
-
126
-
127
-
128
-
129
-
130
-
131
-
132
-
133
-
134
-
135
-
136
-
137
-
138
-
139
-
140
-
141
-
142
-
143
-
144
-
145
-
146
-
147
-
148
-
149
-
150
-
151
-
152
-
153
-
154
-
155
-
156
-
157
-
158
-
159
-
160
-
161
-
162
-
163
-
164
-
165
-
166
-
167
-
168
-
169
-
170
-
171
-
172
-
173
-
174
-
175
-
176
-
177
-
178
-
179
-
180
-
181
-
182
-
183
-
184
-
185
-
186
-
187
-
188
-
189
-
190
-
191
-
192
-
193
-
194
-
195
-
196
-
197
-
198
-
199
-
200
-
201
-
202
-
203
-
204
-
205
-
206
-
207
-
208
-
209
-
210
-
211
-
212
-
213
-
214
-
215
-
216
-
217
-
218
-
219
-
220
-
221
-
222
-
223
-
224
-
225
-
226
-
227
-
228
-
229
-
230
-
231
-
232
-
233
-
234
-
235
-
236
-
 237
237 -
 238
238 -
 239
239 -
 240
240 -
 241
241 -
 242
242 -
 243
243 -
 244
244 -
 245
245 -
 246
246 -
 247
247 -
 248
248 -
 249
249 -
 250
250 -
 251
251 -
 252
252 -
 253
253 -
 254
254 -
 255
255 -
 256
256 -
 257
257 -
258
-
259
-
260
-
261
-
262
-
263
-
264
-
265
-
266
-
267
-
268
-
269
-
270
-
271
-
272
-
273
-
274
-
275
-
276
-
277
-
278
-
279
-
280
-
281
-
282
-
283
-
284
 |
 |

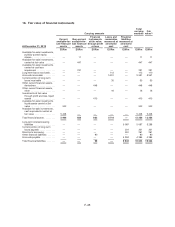
Carrying amounts
Total
carrying
amounts
Fair
value(1)
At December 31, 2011
Current
available-for-
sale financial
assets
Non-current
available-for-
sale financial
assets
Financial
instruments
at fair value
through profit
or loss
Loans and
receivables
measured at
amortized
cost
Financial
liabilities
measured at
amortized
cost
EURm EURm EURm EURm EURm EURm EURm
Available-for-sale investments,
publicly quoted equity
shares ................... — 7 — — — 7 7
Available-for-sale investments,
carried at fair value ........ — 419 — — — 419 419
Available-for-sale investments,
carried at cost less
impairment ............... — 215 — — — 215 215
Long-term loans receivable .... — — — 99 — 99 97
Accounts receivable ......... — — — 7181 — 7181 7181
Current portion of long-term
loans receivable ........... — — — 54 — 54 54
Other current financial assets,
derivatives ................ — — 475 — — 475 475
Other current financial assets,
other .................... — — — 25 — 25 25
Investments at fair value
through profit and loss, liquid
assets ................... — — 433 — — 433 433
Available-for-sale investments,
liquid assets carried at fair
value .................... 1233 — — — 1233 1233
Available for-sale investments,
cash equivalents carried at
fair value ................. 7279 7279 7279
Total financial assets ......... 8 512 641 908 7 359 — 17 420 17 418
Long-term interest-bearing
liabilities ................. — — — — 3969 3969 3929
Other long-term non-interest
bearing financial liabilities . . . — — — — 3 3 3
Current portion of long-term
loans payable ............. — — — — 357 357 357
Short-term borrowing ......... — — — — 995 995 995
Other financial liabilities ...... — — 483 — — 483 483
Accounts payable ........... — — — — 5532 5532 5532
Total financial liabilities ....... — — 483 — 10 856 11 339 11 299
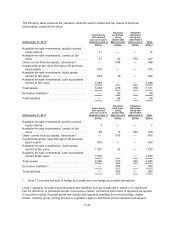
(1) For information about the valuation of items measured at fair value see Note 1. The fair value is
set to carrying amount for available-for-sale investments carried at cost less impairment for which
no reliable fair value has been possible to estimate. The fair value of loan receivables and
payables is estimated based on the current market values of similar instruments. The fair value is
estimated to be equal to the carrying amount for short-term financial assets and financial liabilities
due to limited credit risk and short time to maturity.
F-46