Nokia 2012 Annual Report Download - page 277
Download and view the complete annual report
Please find page 277 of the 2012 Nokia annual report below. You can navigate through the pages in the report by either clicking on the pages listed below, or by using the keyword search tool below to find specific information within the annual report.-
 1
1 -
2
-
3
-
4
-
5
-
6
-
7
-
8
-
9
-
10
-
11
-
12
-
13
-
14
-
15
-
16
-
17
-
18
-
19
-
20
-
21
-
22
-
23
-
24
-
25
-
26
-
27
-
28
-
29
-
30
-
31
-
32
-
33
-
34
-
35
-
36
-
37
-
38
-
39
-
40
-
41
-
42
-
43
-
44
-
45
-
46
-
47
-
48
-
49
-
50
-
51
-
52
-
53
-
54
-
55
-
56
-
57
-
58
-
59
-
60
-
61
-
62
-
63
-
64
-
65
-
66
-
67
-
68
-
69
-
70
-
71
-
72
-
73
-
74
-
75
-
76
-
77
-
78
-
79
-
80
-
81
-
82
-
83
-
84
-
85
-
86
-
87
-
88
-
89
-
90
-
91
-
92
-
93
-
94
-
95
-
96
-
97
-
98
-
99
-
100
-
101
-
102
-
103
-
104
-
105
-
106
-
107
-
108
-
109
-
110
-
111
-
112
-
113
-
114
-
115
-
116
-
117
-
118
-
119
-
120
-
121
-
122
-
123
-
124
-
125
-
126
-
127
-
128
-
129
-
130
-
131
-
132
-
133
-
134
-
135
-
136
-
137
-
138
-
139
-
140
-
141
-
142
-
143
-
144
-
145
-
146
-
147
-
148
-
149
-
150
-
151
-
152
-
153
-
154
-
155
-
156
-
157
-
158
-
159
-
160
-
161
-
162
-
163
-
164
-
165
-
166
-
167
-
168
-
169
-
170
-
171
-
172
-
173
-
174
-
175
-
176
-
177
-
178
-
179
-
180
-
181
-
182
-
183
-
184
-
185
-
186
-
187
-
188
-
189
-
190
-
191
-
192
-
193
-
194
-
195
-
196
-
197
-
198
-
199
-
200
-
201
-
202
-
203
-
204
-
205
-
206
-
207
-
208
-
209
-
210
-
211
-
212
-
213
-
214
-
215
-
216
-
217
-
218
-
219
-
220
-
221
-
222
-
223
-
224
-
225
-
226
-
227
-
228
-
229
-
230
-
231
-
232
-
233
-
234
-
235
-
236
-
237
-
238
-
239
-
240
-
241
-
242
-
243
-
244
-
245
-
246
-
247
-
248
-
249
-
250
-
251
-
252
-
253
-
254
-
255
-
256
-
257
-
258
-
259
-
260
-
261
-
262
-
263
-
264
-
265
-
266
-
 267
267 -
 268
268 -
 269
269 -
 270
270 -
 271
271 -
 272
272 -
 273
273 -
 274
274 -
 275
275 -
 276
276 -
 277
277 -
 278
278 -
 279
279 -
 280
280 -
 281
281 -
 282
282 -
 283
283 -
 284
284
 |
 |

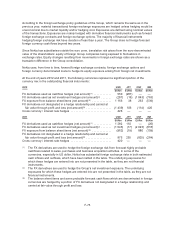
The Group has provided allowances for doubtful accounts as needed on accounts receivable and
loans due from customers and other third parties not past due, based on the analysis of debtors’ credit
quality and credit history. The Group establishes allowances for doubtful accounts that represent an
estimate of incurred losses as of the end of reporting period. All receivables and loans due from
customers and other third parties are considered on an individual basis in establishing the allowances
for doubtful accounts.
As at December 31, 2012, the carrying amount before deducting any allowances for doubtful accounts
as well as amounts expected to be uncollectible for acquired receivables relating to customers for
which an allowance was provided or an uncollectible amount has been identified amounted to
EUR 1 727 million (EUR 2 109 million in 2011). The amount of provision taken against that portion of
these receivables considered to be impaired as well as the amount expected to be uncollectible for
acquired receivables was a total of EUR 264 million (EUR 395 million in 2011) (see also Note 9 and
Note 20). These aforementioned amounts are relative to total net accounts receivable and loans due
from customers and other third parties of EUR 5 625 in 2012 (EUR 7 295 million in 2011).
An amount of EUR 365 million (EUR 316 million in 2011) relates to past due receivables from
customers for which no allowances for doubtful accounts were recognized. The aging of these
receivables is as follows:
2012 2011
EURm EURm
Past due 1-30 days .................................................... 250 169
Past due 31-180 days .................................................. 70 118
More than 180 days .................................................... 45 29
365 316
In 2012, Nokia adjusted the way aging credit notes are taken into account when calculating past due
receivables presented in the table above. This adjustment has increased the amounts of past due
receivables compared to the method used by Nokia in 2011.
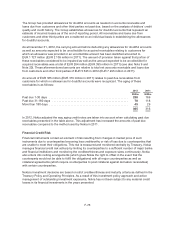
Financial Credit Risk
Financial instruments contain an element of risk resulting from changes in market price of such
instruments due to counterparties becoming less creditworthy or risk of loss due to counterparties that
are unable to meet their obligations. This risk is measured and monitored centrally by Treasury. Nokia
manages financial credit risk actively by limiting its counterparties to a sufficient number of major banks
and financial institutions and monitoring the creditworthiness and exposure sizes continuously. Nokia
also enters into netting arrangements (which gives Nokia the right to offset in the event that the
counterparty would not be able to fulfill the obligations) with all major counterparties as well as
collateral agreements (which require counterparties to post collateral against derivative receivables)
with certain counterparties.
Nokia’s investment decisions are based on strict creditworthiness and maturity criteria as defined in the
Treasury Policy and Operating Principles. As a result of this investment policy approach and active
management of outstanding investment exposures, Nokia has not been subject to any material credit
losses in its financial investments in the years presented.
F-76