Nokia 2012 Annual Report Download - page 11
Download and view the complete annual report
Please find page 11 of the 2012 Nokia annual report below. You can navigate through the pages in the report by either clicking on the pages listed below, or by using the keyword search tool below to find specific information within the annual report.
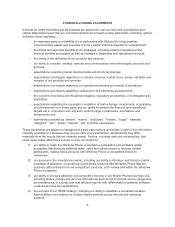
Distribution of Earnings
We distribute retained earnings, if any, within the limits set by the Finnish Companies Act. We make
and calculate the distribution, if any, either in the form of cash dividends, share buy-backs, or in some
other form or a combination of these. There is no specific formula by which the amount of a distribution
is determined, although some limits set by law are discussed below. The timing and amount of future
distributions of retained earnings, if any, will depend on our future results and financial condition.
Under the Finnish Companies Act, we may distribute retained earnings on our shares only upon a
shareholders’ resolution and subject to limited exceptions in the amount proposed by our Board of
Directors. The amount of any distribution is limited to the amount of distributable earnings of the parent
company pursuant to the last accounts approved by our shareholders, taking into account the material
changes in the financial situation of the company after the end of the last financial period and a
statutory requirement that the distribution of earnings must not result in insolvency of the company.
Subject to exceptions relating to the right of minority shareholders to request for a certain minimum
distribution, the distribution may not exceed the amount proposed by the Board of Directors.
Share Buy-backs
Under the Finnish Companies Act, Nokia Corporation may repurchase its own shares pursuant to
either a shareholders’ resolution or an authorization to the Board of Directors approved by the
company’s shareholders. The authorization may amount to a maximum of 10% of all the shares of the
company and its maximum duration is 18 months. The Board of Directors has been regularly
authorized by our shareholders at the Annual General Meetings to repurchase Nokia’s own shares,
and during the past three years the authorization covered 360 million shares in 2010, 2011 and 2012.
The amount authorized each year has been at or slightly under the maximum limit provided by the
Finnish Companies Act. Nokia has not repurchased any of its own shares since September 2008.
On January 24, 2013, we announced that the Board of Directors will propose that the Annual General
Meeting convening on May 7, 2013 authorize the Board to resolve to repurchase a maximum of 370 million
Nokia shares. The proposed maximum number of shares that may be repurchased corresponds to less
than 10% of all the shares of the company. The shares may be repurchased in order to develop the capital
structure of the company, finance or carry out acquisitions or other arrangements, settle the company’s
equity-based incentive plans, be transferred for other purposes, or be cancelled. The shares may be
repurchased either through a tender offer made to all shareholders on equal terms, or in marketplaces by
repurchasing the shares in another proportion than that of the current shareholders. The authorization
would be effective until June 30, 2014 and terminate the current authorization for repurchasing of the
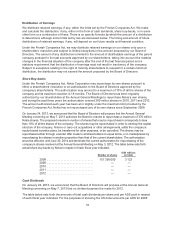
company’s shares resolved at the Annual General Meeting on May 3, 2012. The table below sets forth
actual share buy-backs by Nokia in respect of each fiscal year indicated.
Number of shares
EUR millions
(in total)
2008 ............................... 157390000 3123
2009 ............................... — —
2010 ............................... — —
2011 ............................... — —
2012 ............................... — —
Cash Dividends
On January 24, 2013, we announced that the Board of Directors will propose at the Annual General
Meeting convening on May 7, 2013 that no dividend payment be made for 2012.
The table below sets forth the amounts of total cash dividends per share and per ADS paid in respect
of each fiscal year indicated. For the purposes of showing the US dollar amounts per ADS for 2008
10


