Nokia 2012 Annual Report Download - page 228
Download and view the complete annual report
Please find page 228 of the 2012 Nokia annual report below. You can navigate through the pages in the report by either clicking on the pages listed below, or by using the keyword search tool below to find specific information within the annual report.-
 1
1 -
2
-
3
-
4
-
5
-
6
-
7
-
8
-
9
-
10
-
11
-
12
-
13
-
14
-
15
-
16
-
17
-
18
-
19
-
20
-
21
-
22
-
23
-
24
-
25
-
26
-
27
-
28
-
29
-
30
-
31
-
32
-
33
-
34
-
35
-
36
-
37
-
38
-
39
-
40
-
41
-
42
-
43
-
44
-
45
-
46
-
47
-
48
-
49
-
50
-
51
-
52
-
53
-
54
-
55
-
56
-
57
-
58
-
59
-
60
-
61
-
62
-
63
-
64
-
65
-
66
-
67
-
68
-
69
-
70
-
71
-
72
-
73
-
74
-
75
-
76
-
77
-
78
-
79
-
80
-
81
-
82
-
83
-
84
-
85
-
86
-
87
-
88
-
89
-
90
-
91
-
92
-
93
-
94
-
95
-
96
-
97
-
98
-
99
-
100
-
101
-
102
-
103
-
104
-
105
-
106
-
107
-
108
-
109
-
110
-
111
-
112
-
113
-
114
-
115
-
116
-
117
-
118
-
119
-
120
-
121
-
122
-
123
-
124
-
125
-
126
-
127
-
128
-
129
-
130
-
131
-
132
-
133
-
134
-
135
-
136
-
137
-
138
-
139
-
140
-
141
-
142
-
143
-
144
-
145
-
146
-
147
-
148
-
149
-
150
-
151
-
152
-
153
-
154
-
155
-
156
-
157
-
158
-
159
-
160
-
161
-
162
-
163
-
164
-
165
-
166
-
167
-
168
-
169
-
170
-
171
-
172
-
173
-
174
-
175
-
176
-
177
-
178
-
179
-
180
-
181
-
182
-
183
-
184
-
185
-
186
-
187
-
188
-
189
-
190
-
191
-
192
-
193
-
194
-
195
-
196
-
197
-
198
-
199
-
200
-
201
-
202
-
203
-
204
-
205
-
206
-
207
-
208
-
209
-
210
-
211
-
212
-
213
-
214
-
215
-
216
-
217
-
 218
218 -
 219
219 -
 220
220 -
 221
221 -
 222
222 -
 223
223 -
 224
224 -
 225
225 -
 226
226 -
 227
227 -
 228
228 -
 229
229 -
 230
230 -
 231
231 -
 232
232 -
 233
233 -
 234
234 -
 235
235 -
 236
236 -
 237
237 -
 238
238 -
239
-
240
-
241
-
242
-
243
-
244
-
245
-
246
-
247
-
248
-
249
-
250
-
251
-
252
-
253
-
254
-
255
-
256
-
257
-
258
-
259
-
260
-
261
-
262
-
263
-
264
-
265
-
266
-
267
-
268
-
269
-
270
-
271
-
272
-
273
-
274
-
275
-
276
-
277
-
278
-
279
-
280
-
281
-
282
-
283
-
284
 |
 |

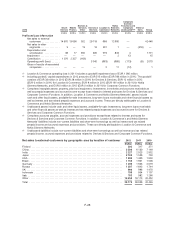
commitment payments are expected to exceed the remaining platform support payments by a total of
approximately EUR 0.5 billion over the remaining life of the agreement. In accordance with the terms of
the agreement, the platform support payments and annual minimum software royalty commitment
payments continue for a corresponding period of time. The Group has recognized a portion of the
received platform support payments as a benefit to our Smart Devices cost of goods sold and the
remainder within accrued expenses and other liabilities. The Microsoft partnership also recognizes the
value of intellectual property and puts in place mechanisms for exchanging intellectual property rights.
The accounting policies of the segments are the same as those described in Note 1. Nokia accounts
for inter-segment revenues and transfers as if the revenues were to third parties, that is, at current
market prices.
No single customer represents 10% or more of Group revenues.
2012
Smart
Devices
Mobile
Phones
Devices &
Services
Other
Devices &
Services
Location &
Commerce
Nokia
Siemens
Networks
Corporate
Common
Functions and
Corporate
unallocated(4)(6)
Elimina-
tions Group
EURm EURm EURm EURm EURm EURm EURm EURm EURm
Profit and Loss Information
Net sales to external
customers ................ 5445 9435 790 15670 729 13777 — 30176
Net sales to other segments . . . 1 — 15 16 374 2 — (392) —
Depreciation and
amortization .............. 22 23 194 239 496 587 4 1326
Impairment ................. — 8 33 41 — 37 31 109
Contribution ................ (1560) 524 (64)
Operating profit (loss) ........ (1100) (301) (799) (103) (2 303)
Share of results of associated
companies ................ — — — — 1 8 (10) (1)
Balance Sheet Information
Capital expenditures(2) ........ 33 11 136 180 64 216 1 461
Segment assets(3) ........... 2 040 1 803 2530 6373 5551 10187 10854 (3016) 29 949
of which:
Investments in associated
companies ............ — — — — 5 32 21 58
Segment liabilities(5) .......... 2762 2320 2091 7173 2885 7756 5704 (3016) 20 502
2011
Smart
Devices
Mobile
Phones
Devices &
Services
Other
Devices &
Services
Location &
Commerce
Nokia
Siemens
Networks
Corporate
Common
Functions and
Corporate
unallocated(4)(6)
Elimina-
tions Group
EURm EURm EURm EURm EURm EURm EURm EURm EURm
Profit and Loss Information
Net sales to external
customers ................ 10818 11930 1178 23926 698 14035 — 38659
Net sales to other segments . . . 2 — 15 17 393 6 — (416) —
Depreciation and
amortization .............. 18 20 315 353 491 711 7 1562
Impairment ................. — 2 168 170 1091 19 58 1338
Contribution ................ (411) 1 481 (186)
Operating profit (loss)(1) ....... 884 (1526) (300) (131) (1 073)
Share of results of associated
companies ................ — — — — 1 (17) (7) (23)
Balance Sheet Information
Capital expenditures(2) ........ 21 18 213 252 43 302 — 597
Segment assets(3) ........... 2367 1999 4299 8665 5257 11310 13505 (2532) 36 205
of which:
Investments in associated
companies ............ — — — — 4 29 34 67
Segment liabilities(5) .......... 2528 1270 5696 9494 2812 7520 4995 (2532) 22 289
F-27