Nokia 2012 Annual Report Download - page 274
Download and view the complete annual report
Please find page 274 of the 2012 Nokia annual report below. You can navigate through the pages in the report by either clicking on the pages listed below, or by using the keyword search tool below to find specific information within the annual report.-
 1
1 -
2
-
3
-
4
-
5
-
6
-
7
-
8
-
9
-
10
-
11
-
12
-
13
-
14
-
15
-
16
-
17
-
18
-
19
-
20
-
21
-
22
-
23
-
24
-
25
-
26
-
27
-
28
-
29
-
30
-
31
-
32
-
33
-
34
-
35
-
36
-
37
-
38
-
39
-
40
-
41
-
42
-
43
-
44
-
45
-
46
-
47
-
48
-
49
-
50
-
51
-
52
-
53
-
54
-
55
-
56
-
57
-
58
-
59
-
60
-
61
-
62
-
63
-
64
-
65
-
66
-
67
-
68
-
69
-
70
-
71
-
72
-
73
-
74
-
75
-
76
-
77
-
78
-
79
-
80
-
81
-
82
-
83
-
84
-
85
-
86
-
87
-
88
-
89
-
90
-
91
-
92
-
93
-
94
-
95
-
96
-
97
-
98
-
99
-
100
-
101
-
102
-
103
-
104
-
105
-
106
-
107
-
108
-
109
-
110
-
111
-
112
-
113
-
114
-
115
-
116
-
117
-
118
-
119
-
120
-
121
-
122
-
123
-
124
-
125
-
126
-
127
-
128
-
129
-
130
-
131
-
132
-
133
-
134
-
135
-
136
-
137
-
138
-
139
-
140
-
141
-
142
-
143
-
144
-
145
-
146
-
147
-
148
-
149
-
150
-
151
-
152
-
153
-
154
-
155
-
156
-
157
-
158
-
159
-
160
-
161
-
162
-
163
-
164
-
165
-
166
-
167
-
168
-
169
-
170
-
171
-
172
-
173
-
174
-
175
-
176
-
177
-
178
-
179
-
180
-
181
-
182
-
183
-
184
-
185
-
186
-
187
-
188
-
189
-
190
-
191
-
192
-
193
-
194
-
195
-
196
-
197
-
198
-
199
-
200
-
201
-
202
-
203
-
204
-
205
-
206
-
207
-
208
-
209
-
210
-
211
-
212
-
213
-
214
-
215
-
216
-
217
-
218
-
219
-
220
-
221
-
222
-
223
-
224
-
225
-
226
-
227
-
228
-
229
-
230
-
231
-
232
-
233
-
234
-
235
-
236
-
237
-
238
-
239
-
240
-
241
-
242
-
243
-
244
-
245
-
246
-
247
-
248
-
249
-
250
-
251
-
252
-
253
-
254
-
255
-
256
-
257
-
258
-
259
-
260
-
261
-
262
-
263
-
 264
264 -
 265
265 -
 266
266 -
 267
267 -
 268
268 -
 269
269 -
 270
270 -
 271
271 -
 272
272 -
 273
273 -
 274
274 -
 275
275 -
 276
276 -
 277
277 -
 278
278 -
 279
279 -
 280
280 -
 281
281 -
 282
282 -
 283
283 -
 284
284
 |
 |

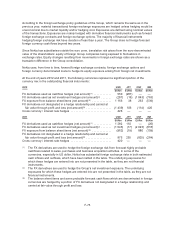
According to the foreign exchange policy guidelines of the Group, which remains the same as in the
previous year, material transactional foreign exchange exposures are hedged unless hedging would be
uneconomical due to market liquidity and/or hedging cost. Exposures are defined using nominal values
of the transactions. Exposures are mainly hedged with derivative financial instruments such as forward
foreign exchange contracts and foreign exchange options. The majority of financial instruments
hedging foreign exchange risk have duration of less than a year. The Group does not hedge forecast
foreign currency cash flows beyond two years.
Since Nokia has subsidiaries outside the euro zone, translation risk arises from the euro-denominated
value of the shareholders’ equity of foreign Group companies being exposed to fluctuations in
exchange rates. Equity changes resulting from movements in foreign exchange rates are shown as a
translation difference in the Group consolidation.
Nokia uses, from time to time, forward foreign exchange contracts, foreign exchange options and
foreign currency denominated loans to hedge its equity exposure arising from foreign net investments.
At the end of years 2012 and 2011, the following currencies represent a significant portion of the
currency mix in the outstanding financial instruments:
2012 USD JPY CNY INR
EURm EURm EURm EURm
FX derivatives used as cashflow hedges (net amount)(1) ............ 550 (281) — —
FX derivatives used as net investment hedges (net amount)(2) ....... (281) (16) (1 043) (763)
FX exposure from balance sheet items (net amount)(3) ............. 1156 38 263 (539)
FX derivatives not designated in a hedge relationship and carried at
fair value through profit and loss (net amount)(3) ................. (1439) 106 (114) 420
Cross currency / interest rate hedges ........................... 428 — — —
2011 USD JPY CNY INR
EURm EURm EURm EURm
FX derivatives used as cashflow hedges (net amount)(1) ............ 1282 110 — (20)
FX derivatives used as net investment hedges (net amount)(2) ....... (1045) (17) (2 023) (818)
FX exposure from balance sheet items (net amount)(3) ............. (962) (19) 880 (109)
FX derivatives not designated in a hedge relationship and carried at
fair value through profit and loss (net amount)(3) ................. 875 255 (825) (264)
Cross currency / interest rate hedges ........................... 420 — — —
(1) The FX derivatives are used to hedge the foreign exchange risk from forecast highly probable
cashflows related to sales, purchases and business acquisition activities. In some of the
currencies, especially in US dollar, Nokia has substantial foreign exchange risks in both estimated
cash inflows and outflows, which have been netted in the table. The underlying exposures for
which these hedges are entered into are not presented in the table, as they are not financial
instruments.
(2) The FX derivatives are used to hedge the Group’s net investment exposure. The underlying
exposures for which these hedges are entered into are not presented in the table, as they are not
financial instruments.
(3) The balance sheet items and some probable forecast cash flows which are denominated in foreign
currencies are hedged by a portion of FX derivatives not designated in a hedge relationship and
carried at fair value through profit and loss.
F-73