Nokia 2012 Annual Report Download - page 83
Download and view the complete annual report
Please find page 83 of the 2012 Nokia annual report below. You can navigate through the pages in the report by either clicking on the pages listed below, or by using the keyword search tool below to find specific information within the annual report.-
 1
1 -
2
-
3
-
4
-
5
-
6
-
7
-
8
-
9
-
10
-
11
-
12
-
13
-
14
-
15
-
16
-
17
-
18
-
19
-
20
-
21
-
22
-
23
-
24
-
25
-
26
-
27
-
28
-
29
-
30
-
31
-
32
-
33
-
34
-
35
-
36
-
37
-
38
-
39
-
40
-
41
-
42
-
43
-
44
-
45
-
46
-
47
-
48
-
49
-
50
-
51
-
52
-
53
-
54
-
55
-
56
-
57
-
58
-
59
-
60
-
61
-
62
-
63
-
64
-
65
-
66
-
67
-
68
-
69
-
70
-
71
-
72
-
 73
73 -
 74
74 -
 75
75 -
 76
76 -
 77
77 -
 78
78 -
 79
79 -
 80
80 -
 81
81 -
 82
82 -
 83
83 -
 84
84 -
 85
85 -
 86
86 -
 87
87 -
 88
88 -
 89
89 -
 90
90 -
 91
91 -
 92
92 -
 93
93 -
94
-
95
-
96
-
97
-
98
-
99
-
100
-
101
-
102
-
103
-
104
-
105
-
106
-
107
-
108
-
109
-
110
-
111
-
112
-
113
-
114
-
115
-
116
-
117
-
118
-
119
-
120
-
121
-
122
-
123
-
124
-
125
-
126
-
127
-
128
-
129
-
130
-
131
-
132
-
133
-
134
-
135
-
136
-
137
-
138
-
139
-
140
-
141
-
142
-
143
-
144
-
145
-
146
-
147
-
148
-
149
-
150
-
151
-
152
-
153
-
154
-
155
-
156
-
157
-
158
-
159
-
160
-
161
-
162
-
163
-
164
-
165
-
166
-
167
-
168
-
169
-
170
-
171
-
172
-
173
-
174
-
175
-
176
-
177
-
178
-
179
-
180
-
181
-
182
-
183
-
184
-
185
-
186
-
187
-
188
-
189
-
190
-
191
-
192
-
193
-
194
-
195
-
196
-
197
-
198
-
199
-
200
-
201
-
202
-
203
-
204
-
205
-
206
-
207
-
208
-
209
-
210
-
211
-
212
-
213
-
214
-
215
-
216
-
217
-
218
-
219
-
220
-
221
-
222
-
223
-
224
-
225
-
226
-
227
-
228
-
229
-
230
-
231
-
232
-
233
-
234
-
235
-
236
-
237
-
238
-
239
-
240
-
241
-
242
-
243
-
244
-
245
-
246
-
247
-
248
-
249
-
250
-
251
-
252
-
253
-
254
-
255
-
256
-
257
-
258
-
259
-
260
-
261
-
262
-
263
-
264
-
265
-
266
-
267
-
268
-
269
-
270
-
271
-
272
-
273
-
274
-
275
-
276
-
277
-
278
-
279
-
280
-
281
-
282
-
283
-
284
 |
 |
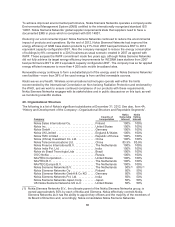
We have three businesses: Devices & Services, HERE (formerly Location & Commerce) and Nokia
Siemens Networks, and four operating and reportable segments for financial reporting purposes: Smart
Devices and Mobile Phones within our Devices & Services business; HERE; and Nokia Siemens
Networks.
Our Devices & Services business includes two operating and reportable segments —Smart Devices,
which focuses on our most advanced products, including Lumia smartphones, and Mobile Phones,
which focuses on our most affordable products, including Asha full touch smartphones—as well as
Devices & Services Other. Devices & Services Other includes intellectual property income, net sales of
spare parts and related cost of sales and operating expenses and common research and development
expenses. Devices & Services Other also included our luxury phone business Vertu until October 12,
2012, when we sold most of our shareholding in Vertu to the private equity fund EQT VI.
We acquired NAVTEQ in July 2008 which was a separate reportable segment until the end of the third
quarter of 2011. As of October 1, 2011, the Location & Commerce business was formed as a new
operating and reportable segment by combining NAVTEQ and our Devices & Services social location
services operations. In November 2012, we introduced HERE as the new brand for Nokia’s
location-based products and services. As of January 1, 2013 our Location & Commerce business and
reportable segment was renamed as the HERE reportable segment. HERE focuses on the
development of location-based products and services for a broad range of devices and operating
systems, including our Lumia smartphones and local commerce.
Prior period results were regrouped and recast for comparability purposes according to the new
reporting format that became effective on April 1, 2011 for our Devices & Services business and
October 1, 2011 for our location-based business.
In the discussion below of our Results of Operations, we provide information on the average selling
price (ASP) of our mobile devices. ASP is a commonly used measure in our industry to track price
developments generally from period to period and also in comparison to our competitors. We provide
our ASP at two levels: (i) total mobile device ASP at the Devices & Services business level and
(ii) mobile device ASP at each of our Smart Devices and Mobile Phones business unit levels. We
believe that our total mobile device ASP provides investors with an overall view of pricing
developments at a time when the distinction between different product classifications of mobile devices
is blurring. Also, we have a long history of providing ASP at the Devices & Services level, which allows
investors to follow the progress of this measure over a long period of time. At the same time, we
provide transparency on the ASP developments for our products within each of the Smart Devices and
Mobile Phones classifications.
Our total mobile device ASP represents total Devices & Services net sales—comprised of our Smart
Devices, Mobile Phones and Devices & Services Other net sales—divided by total Devices & Services
volumes. Devices & Services Other net sales includes net sales of Nokia’s luxury phone business
Vertu through October 12, 2012, spare parts, as well as IPR income. As IPR income is included in
Devices & Services Other net sales, we provide our total mobile device ASP both including and
excluding IPR income. Smart Devices ASP represents Smart Devices net sales divided by Smart
Devices volumes. Mobile Phones ASP represents Mobile Phones net sales divided by Mobile Phones
volumes. IPR income is not recognized at the Smart Devices and Mobile Phone business unit levels.
The presentation of Nokia Siemens Networks’ restructuring and other associated expenses has been
aligned with other Nokia businesses and included within other expenses instead of impacting functions.
Accordingly, included in other expenses in 2011 is EUR 126 million of restructuring charges, previously
reflected within cost of sales (EUR 40 million), R&D (EUR 28 million), selling and marketing
(EUR 22 million) and administrative expenses (EUR 36 million). Included in other expenses in 2010 is
82