Nokia 2012 Annual Report Download - page 241
Download and view the complete annual report
Please find page 241 of the 2012 Nokia annual report below. You can navigate through the pages in the report by either clicking on the pages listed below, or by using the keyword search tool below to find specific information within the annual report.-
 1
1 -
2
-
3
-
4
-
5
-
6
-
7
-
8
-
9
-
10
-
11
-
12
-
13
-
14
-
15
-
16
-
17
-
18
-
19
-
20
-
21
-
22
-
23
-
24
-
25
-
26
-
27
-
28
-
29
-
30
-
31
-
32
-
33
-
34
-
35
-
36
-
37
-
38
-
39
-
40
-
41
-
42
-
43
-
44
-
45
-
46
-
47
-
48
-
49
-
50
-
51
-
52
-
53
-
54
-
55
-
56
-
57
-
58
-
59
-
60
-
61
-
62
-
63
-
64
-
65
-
66
-
67
-
68
-
69
-
70
-
71
-
72
-
73
-
74
-
75
-
76
-
77
-
78
-
79
-
80
-
81
-
82
-
83
-
84
-
85
-
86
-
87
-
88
-
89
-
90
-
91
-
92
-
93
-
94
-
95
-
96
-
97
-
98
-
99
-
100
-
101
-
102
-
103
-
104
-
105
-
106
-
107
-
108
-
109
-
110
-
111
-
112
-
113
-
114
-
115
-
116
-
117
-
118
-
119
-
120
-
121
-
122
-
123
-
124
-
125
-
126
-
127
-
128
-
129
-
130
-
131
-
132
-
133
-
134
-
135
-
136
-
137
-
138
-
139
-
140
-
141
-
142
-
143
-
144
-
145
-
146
-
147
-
148
-
149
-
150
-
151
-
152
-
153
-
154
-
155
-
156
-
157
-
158
-
159
-
160
-
161
-
162
-
163
-
164
-
165
-
166
-
167
-
168
-
169
-
170
-
171
-
172
-
173
-
174
-
175
-
176
-
177
-
178
-
179
-
180
-
181
-
182
-
183
-
184
-
185
-
186
-
187
-
188
-
189
-
190
-
191
-
192
-
193
-
194
-
195
-
196
-
197
-
198
-
199
-
200
-
201
-
202
-
203
-
204
-
205
-
206
-
207
-
208
-
209
-
210
-
211
-
212
-
213
-
214
-
215
-
216
-
217
-
218
-
219
-
220
-
221
-
222
-
223
-
224
-
225
-
226
-
227
-
228
-
229
-
230
-
 231
231 -
 232
232 -
 233
233 -
 234
234 -
 235
235 -
 236
236 -
 237
237 -
 238
238 -
 239
239 -
 240
240 -
 241
241 -
 242
242 -
 243
243 -
 244
244 -
 245
245 -
 246
246 -
 247
247 -
 248
248 -
 249
249 -
 250
250 -
 251
251 -
252
-
253
-
254
-
255
-
256
-
257
-
258
-
259
-
260
-
261
-
262
-
263
-
264
-
265
-
266
-
267
-
268
-
269
-
270
-
271
-
272
-
273
-
274
-
275
-
276
-
277
-
278
-
279
-
280
-
281
-
282
-
283
-
284
 |
 |

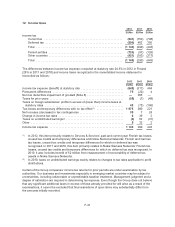
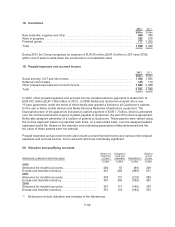
11. Financial income and expenses
2012 2011 2010
EURm EURm EURm
Dividend income on available-for-sale financial investments ................. 322
Interest income on available-for-sale financial investments .................. 119 169 110
Interest income on loans receivables carried at amortized cost .............. 31—
Interest income on investments at fair value through profit and loss ........... 818 28
Net interest income (expense) on derivatives not under hedge accounting ..... (4) (12) (20)
Interest expense on financial liabilities carried at amortized cost ............. (264) (255) (254)
Net realised gains (or losses) on disposal of fixed income available-for-sale
financial investments ............................................... (1) (4) 1
Net fair value gains (or losses) on investments at fair value through profit and
loss ............................................................. 27 102 (3)
Net gains (net losses) on other derivatives designated at fair value through
profit and loss ..................................................... (11) (121) 19
Net fair value gains (or losses) on hedged items under fair value hedge
accounting ....................................................... (15) (82) (63)
Net fair value gains (or losses) on hedging instruments under fair value hedge
accounting ....................................................... 23 72 58
Net foreign exchange gains (or losses)
From foreign exchange derivatives designated at fair value through profit
and loss ...................................................... (73) 74 58
From balance sheet items revaluation ............................... (173) (34) (165)
Other financial income(1) .............................................. 52 49 73
Other financial expenses(2) ............................................ (34) (81) (129)
Total .............................................................. (340) (102) (285)
(1) Other financial income includes distributions of EUR 49 million in 2012 (EUR 45 million in 2011
and EUR 69 million in 2010) from a private fund held as non-current available-for-sale.
(2) Other financial expenses include an impairment loss of EUR 7 million in 2012 (EUR 38 million in
2011 and EUR 94 million in 2010) in the Group’s investment in the above mentioned private fund
due to changes in estimated future cash flows resulting from distributions received as well as other
factors. The Group did not recognize any impairment losses related to Asset Backed Securities in
2012 in other financial expenses, whereas impairments for these securities amounted to
EUR 15 million in 2011 and EUR 0 million in 2010. Additional information can be found in Note 8
and Note 16.
During 2012, interest income decreased mainly as a result of lower cash levels than in 2011 and lower
interest rates in certain currencies where the Group has investments. Foreign exchange gains (or
losses) were negatively impacted by higher hedging costs than in 2011 as well as significant
weakening of certain emerging market currencies.
During 2011, interest income increased mainly as a result of higher cash levels than in 2010 and
higher interest rates in certain currencies where the Group has investments. Lower interest rates in
EUR and USD had a positive impact on Net fair value gains (or losses) on investments at fair value
through profit and loss but these gains were offset by the negative impact on Net gains (or losses) on
other derivatives designated at fair value through profit and loss that was affected by similar factors.
Foreign exchange gains (or losses) were positively impacted by low and in some cases negative
hedging costs (i.e. income) in 2011 as well as increased volatility on the foreign exchange market.
F-40