Nokia 2012 Annual Report Download - page 148
Download and view the complete annual report
Please find page 148 of the 2012 Nokia annual report below. You can navigate through the pages in the report by either clicking on the pages listed below, or by using the keyword search tool below to find specific information within the annual report.-
 1
1 -
2
-
3
-
4
-
5
-
6
-
7
-
8
-
9
-
10
-
11
-
12
-
13
-
14
-
15
-
16
-
17
-
18
-
19
-
20
-
21
-
22
-
23
-
24
-
25
-
26
-
27
-
28
-
29
-
30
-
31
-
32
-
33
-
34
-
35
-
36
-
37
-
38
-
39
-
40
-
41
-
42
-
43
-
44
-
45
-
46
-
47
-
48
-
49
-
50
-
51
-
52
-
53
-
54
-
55
-
56
-
57
-
58
-
59
-
60
-
61
-
62
-
63
-
64
-
65
-
66
-
67
-
68
-
69
-
70
-
71
-
72
-
73
-
74
-
75
-
76
-
77
-
78
-
79
-
80
-
81
-
82
-
83
-
84
-
85
-
86
-
87
-
88
-
89
-
90
-
91
-
92
-
93
-
94
-
95
-
96
-
97
-
98
-
99
-
100
-
101
-
102
-
103
-
104
-
105
-
106
-
107
-
108
-
109
-
110
-
111
-
112
-
113
-
114
-
115
-
116
-
117
-
118
-
119
-
120
-
121
-
122
-
123
-
124
-
125
-
126
-
127
-
128
-
129
-
130
-
131
-
132
-
133
-
134
-
135
-
136
-
137
-
 138
138 -
 139
139 -
 140
140 -
 141
141 -
 142
142 -
 143
143 -
 144
144 -
 145
145 -
 146
146 -
 147
147 -
 148
148 -
 149
149 -
 150
150 -
 151
151 -
 152
152 -
 153
153 -
 154
154 -
 155
155 -
 156
156 -
 157
157 -
 158
158 -
159
-
160
-
161
-
162
-
163
-
164
-
165
-
166
-
167
-
168
-
169
-
170
-
171
-
172
-
173
-
174
-
175
-
176
-
177
-
178
-
179
-
180
-
181
-
182
-
183
-
184
-
185
-
186
-
187
-
188
-
189
-
190
-
191
-
192
-
193
-
194
-
195
-
196
-
197
-
198
-
199
-
200
-
201
-
202
-
203
-
204
-
205
-
206
-
207
-
208
-
209
-
210
-
211
-
212
-
213
-
214
-
215
-
216
-
217
-
218
-
219
-
220
-
221
-
222
-
223
-
224
-
225
-
226
-
227
-
228
-
229
-
230
-
231
-
232
-
233
-
234
-
235
-
236
-
237
-
238
-
239
-
240
-
241
-
242
-
243
-
244
-
245
-
246
-
247
-
248
-
249
-
250
-
251
-
252
-
253
-
254
-
255
-
256
-
257
-
258
-
259
-
260
-
261
-
262
-
263
-
264
-
265
-
266
-
267
-
268
-
269
-
270
-
271
-
272
-
273
-
274
-
275
-
276
-
277
-
278
-
279
-
280
-
281
-
282
-
283
-
284
 |
 |

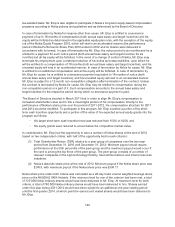
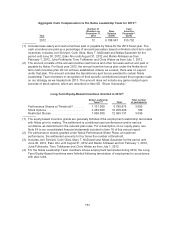
Short-term cash incentives are an important element of our variable pay programs and are tied directly
to Nokia-level financial and strategic goals that are shared by the Nokia Leadership Team. The short-
term cash incentive opportunity is expressed as a percentage of each executive officer’s annual base
salary. These award opportunities and measurement criteria are presented in the table below.
Short-term incentives are determined for the Nokia Leadership Team based on their performance as a
team. Additionally, some members of the Nokia Leadership Team have an objective on relative Total
Shareholder Return (TSR). The payment with respect to relative TSR is based on the Personnel
Committee’s assessment of Nokia’s total shareholder return compared to key peer group companies
that are selected by the Personnel Committee in the high technology, Internet services and
telecommunications industries and relevant market indices over one-, three- and five-year periods.
The specific goals and underlying targets require the Board’s approval with respect to the President
and CEO and the Personnel Committee’s approval with respect to the other members of the Nokia
Leadership Team.
The following table reflects the measurement criteria that were established for the President and CEO
and members of the Nokia Leadership Team for the year 2012. The short-term incentive payout is
based on performance relative to targets set for each measurement criteria listed in the table.
Short-Term Incentive as a % of Annual Base Salary in 2012
Position
Minimum
Performance
Target
Performance
Maximum
Performance Measurement Criteria
President and
CEO .......... 0% 100% 200% Key financial targets(1) (including gross
profit, OPEX and net cash flow); and
Nokia Leadership
Team ......... 0% 75% 150% Strategic objectives(1) (including targets
for performance of Nokia’s product and
service portfolio);
Certain Nokia
Leadership
Team members
(in addition to
above) ........ 0% 25% 50%
Total Shareholder Return(2) (comparison
made with key competitors in the high
technology, telecommunications and
Internet services industries over one-,
three- and five-year periods)
(1) One Nokia Leadership Team member’s incentive structure is also tied to specific sales and gross
margin targets in addition to the key financial targets and strategic objectives.
(2) Total Shareholder Return reflects the change in Nokia’s share price during an established time
period, including the amount of dividends paid, divided by Nokia’s share price at the beginning of the
period. The calculation is conducted in the same manner for each company in the peer group. Only
certain members of the Nokia Leadership Team are eligible for the additional Total Shareholder
Return element. For Stephen Elop, Total Shareholder Return was measured in the one-time special
CEO incentive program approved by the Board of Directors for the two-year period 2011-2012.
Annual incentive cash bonus under the Nokia short-term cash incentive plan is paid once per year
based on pre-determined Nokia performance criteria assessed as of December 31, 2012. To
determine the pay-out under the Nokia short-term cash incentive plan, the Personnel Committee
approved incentive goals are evaluated against pre-defined achievement criteria. The resulting scores
are then calculated against each executive individual incentive target to ascertain an individual pay-out
percent. The executive’s annual base salary is then multiplied by the pay-out percent to determine the
pay-out amount. The achievement scores and individual pay-out percent and amount is presented to
147