Nokia 2012 Annual Report Download - page 12
Download and view the complete annual report
Please find page 12 of the 2012 Nokia annual report below. You can navigate through the pages in the report by either clicking on the pages listed below, or by using the keyword search tool below to find specific information within the annual report.-
 1
1 -
 2
2 -
 3
3 -
 4
4 -
 5
5 -
 6
6 -
 7
7 -
 8
8 -
 9
9 -
 10
10 -
 11
11 -
 12
12 -
 13
13 -
 14
14 -
 15
15 -
 16
16 -
 17
17 -
 18
18 -
 19
19 -
 20
20 -
 21
21 -
 22
22 -
23
-
24
-
25
-
26
-
27
-
28
-
29
-
30
-
31
-
32
-
33
-
34
-
35
-
36
-
37
-
38
-
39
-
40
-
41
-
42
-
43
-
44
-
45
-
46
-
47
-
48
-
49
-
50
-
51
-
52
-
53
-
54
-
55
-
56
-
57
-
58
-
59
-
60
-
61
-
62
-
63
-
64
-
65
-
66
-
67
-
68
-
69
-
70
-
71
-
72
-
73
-
74
-
75
-
76
-
77
-
78
-
79
-
80
-
81
-
82
-
83
-
84
-
85
-
86
-
87
-
88
-
89
-
90
-
91
-
92
-
93
-
94
-
95
-
96
-
97
-
98
-
99
-
100
-
101
-
102
-
103
-
104
-
105
-
106
-
107
-
108
-
109
-
110
-
111
-
112
-
113
-
114
-
115
-
116
-
117
-
118
-
119
-
120
-
121
-
122
-
123
-
124
-
125
-
126
-
127
-
128
-
129
-
130
-
131
-
132
-
133
-
134
-
135
-
136
-
137
-
138
-
139
-
140
-
141
-
142
-
143
-
144
-
145
-
146
-
147
-
148
-
149
-
150
-
151
-
152
-
153
-
154
-
155
-
156
-
157
-
158
-
159
-
160
-
161
-
162
-
163
-
164
-
165
-
166
-
167
-
168
-
169
-
170
-
171
-
172
-
173
-
174
-
175
-
176
-
177
-
178
-
179
-
180
-
181
-
182
-
183
-
184
-
185
-
186
-
187
-
188
-
189
-
190
-
191
-
192
-
193
-
194
-
195
-
196
-
197
-
198
-
199
-
200
-
201
-
202
-
203
-
204
-
205
-
206
-
207
-
208
-
209
-
210
-
211
-
212
-
213
-
214
-
215
-
216
-
217
-
218
-
219
-
220
-
221
-
222
-
223
-
224
-
225
-
226
-
227
-
228
-
229
-
230
-
231
-
232
-
233
-
234
-
235
-
236
-
237
-
238
-
239
-
240
-
241
-
242
-
243
-
244
-
245
-
246
-
247
-
248
-
249
-
250
-
251
-
252
-
253
-
254
-
255
-
256
-
257
-
258
-
259
-
260
-
261
-
262
-
263
-
264
-
265
-
266
-
267
-
268
-
269
-
270
-
271
-
272
-
273
-
274
-
275
-
276
-
277
-
278
-
279
-
280
-
281
-
282
-
283
-
284
 |
 |

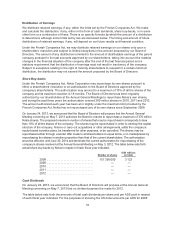
through 2012, the dividend per share amounts have been translated into US dollars at the noon buying
rate in New York City for cable transfers in euro as certified for customs purposes by the Federal
Reserve Bank of New York on the respective dividend payment dates.
EUR per share USD per ADS
EUR millions
(in total)
2008 ............................ 0.40 0.54 1 481
2009 ............................ 0.40 0.49 1 483
2010 ............................ 0.40 0.57 1 484
2011 ............................ 0.20 0.25 742
2012 ............................ 0.00(1) 0.00(1) 0(1)
(1) The Nokia Board of Directors will propose at the Annual General Meeting convening on
May 7, 2013 that no dividend payment be made for 2012.
We make our cash dividend payments in euro. As a result, exchange rate fluctuations will affect the US
dollar amount received by holders of ADSs on conversion of these dividends. Moreover, fluctuations in
the exchange rates between the euro and the US dollar will affect the dollar equivalent of the euro
price of the shares on NASDAQ OMX Helsinki and, as a result, are likely to affect the market price of
the ADSs in the United States. See also Item 3D. “Risk Factors—Our net sales, costs and results of
operations, as well as the US dollar value of our dividends and market price of our ADSs, are affected
by exchange rate fluctuations, particularly between the euro, which is our reporting currency, and the
US dollar, the Japanese yen and the Chinese yuan, as well as certain other currencies.”
Exchange Rate Data
The following table sets forth information concerning the noon buying rate for the years 2008 through
2012 and for each of the months in the six-month period ended February 28, 2013, expressed in US
dollars per euro. The average rate for a year means the average of the exchange rates on the last day
of each month during a year. The average rate for a month means the average of the daily exchange
rates during that month.
Exchange rates
For the year ended December 31:
Rate at
Period
end
Average
rate
Highest
rate
Lowest
rate
(USD per EUR)
2008 ....................................... 1.3919 1.4695 1.6010 1.2446
2009 ....................................... 1.4332 1.3955 1.5100 1.2547
2010 ....................................... 1.3269 1.3216 1.4536 1.1959
2011 ....................................... 1.2973 1.3931 1.4875 1.2926
2012 ....................................... 1.3186 1.2859 1.3463 1.2062
September 30, 2012 .......................... 1.2856 1.2885 1.3142 1.2566
October 31, 2012 ............................. 1.2958 1.2974 1.3133 1.2876
November 30, 2012 ........................... 1.3010 1.2837 1.3010 1.2715
December 31, 2012 ........................... 1.3186 1.3119 1.3260 1.2930
January 31, 2013 ............................. 1.3584 1.3304 1.3584 1.3047
February 28, 2013 ............................ 1.3079 1.3347 1.3692 1.3054
On March 1, 2013, the noon buying rate was USD 1.2988 per EUR 1.00.
3B. Capitalization and Indebtedness
Not applicable.
3C. Reasons for the Offer and Use of Proceeds
Not applicable.
11