Nokia 2012 Annual Report Download - page 238
Download and view the complete annual report
Please find page 238 of the 2012 Nokia annual report below. You can navigate through the pages in the report by either clicking on the pages listed below, or by using the keyword search tool below to find specific information within the annual report.-
 1
1 -
2
-
3
-
4
-
5
-
6
-
7
-
8
-
9
-
10
-
11
-
12
-
13
-
14
-
15
-
16
-
17
-
18
-
19
-
20
-
21
-
22
-
23
-
24
-
25
-
26
-
27
-
28
-
29
-
30
-
31
-
32
-
33
-
34
-
35
-
36
-
37
-
38
-
39
-
40
-
41
-
42
-
43
-
44
-
45
-
46
-
47
-
48
-
49
-
50
-
51
-
52
-
53
-
54
-
55
-
56
-
57
-
58
-
59
-
60
-
61
-
62
-
63
-
64
-
65
-
66
-
67
-
68
-
69
-
70
-
71
-
72
-
73
-
74
-
75
-
76
-
77
-
78
-
79
-
80
-
81
-
82
-
83
-
84
-
85
-
86
-
87
-
88
-
89
-
90
-
91
-
92
-
93
-
94
-
95
-
96
-
97
-
98
-
99
-
100
-
101
-
102
-
103
-
104
-
105
-
106
-
107
-
108
-
109
-
110
-
111
-
112
-
113
-
114
-
115
-
116
-
117
-
118
-
119
-
120
-
121
-
122
-
123
-
124
-
125
-
126
-
127
-
128
-
129
-
130
-
131
-
132
-
133
-
134
-
135
-
136
-
137
-
138
-
139
-
140
-
141
-
142
-
143
-
144
-
145
-
146
-
147
-
148
-
149
-
150
-
151
-
152
-
153
-
154
-
155
-
156
-
157
-
158
-
159
-
160
-
161
-
162
-
163
-
164
-
165
-
166
-
167
-
168
-
169
-
170
-
171
-
172
-
173
-
174
-
175
-
176
-
177
-
178
-
179
-
180
-
181
-
182
-
183
-
184
-
185
-
186
-
187
-
188
-
189
-
190
-
191
-
192
-
193
-
194
-
195
-
196
-
197
-
198
-
199
-
200
-
201
-
202
-
203
-
204
-
205
-
206
-
207
-
208
-
209
-
210
-
211
-
212
-
213
-
214
-
215
-
216
-
217
-
218
-
219
-
220
-
221
-
222
-
223
-
224
-
225
-
226
-
227
-
 228
228 -
 229
229 -
 230
230 -
 231
231 -
 232
232 -
 233
233 -
 234
234 -
 235
235 -
 236
236 -
 237
237 -
 238
238 -
 239
239 -
 240
240 -
 241
241 -
 242
242 -
 243
243 -
 244
244 -
 245
245 -
 246
246 -
 247
247 -
 248
248 -
249
-
250
-
251
-
252
-
253
-
254
-
255
-
256
-
257
-
258
-
259
-
260
-
261
-
262
-
263
-
264
-
265
-
266
-
267
-
268
-
269
-
270
-
271
-
272
-
273
-
274
-
275
-
276
-
277
-
278
-
279
-
280
-
281
-
282
-
283
-
284
 |
 |
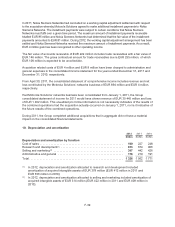
Other intangible assets
During 2012, EUR 8 million impairment charge was recorded on certain technology assets due to
obsolescense within Mobile Phones. Furthermore, a charge of EUR 8 million was recorded on
intangible assets attributable to the decision to transition certain operations into maintenance mode
within Nokia Siemens Networks. All charges were recorded in other operating expenses.
Property, plant and equipment and inventories
During 2012, the Group recognized EUR 31 million impairment losses related to restructuring activities
mainly with respect to its Salo, Finland and Komarom, Hungary facilities within other operating
expenses of Devices & Services Other. Nokia Siemens Networks recorded an impairment loss of EUR
23 million to reflect non-current assets of Optical Networks business at market value, in anticipation of
sale of the business.
Majority of 2011 impairment losses recognized with respect to property, plant and equipment
resulted from EUR 94 million charges related to the Group’s restructuring programs, including the
closure of manufacturing operations in Cluj, Romania, and consolidation of other office sites.
The charges were recorded in other operating expense and are included in Devices & Services Other.
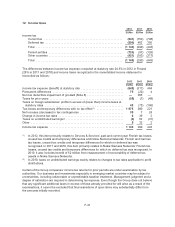
Investments in associated companies
After application of the equity method, including recognition of the Group’s share of results of
associated companies, the Group determined that recognition of impairment losses of EUR 8 million
in 2012 (EUR 41 million in 2011, EUR 0 million in 2010) was necessary to adjust the Group’s
investment in associated companies to its recoverable amount. The charges were recorded in other
operating expense and are included in Devices & Services Other.
Available-for-sale investments
The Group’s investment in certain equity and interest-bearing securities held as available-for-sale
suffered a significant or prolonged decline in fair value resulting in an impairment charge of EUR
31 million (EUR 94 million in 2011, EUR 107 million in 2010). These impairment losses are included
within financial expenses and other operating expenses in the consolidated income statement. See
also Note 11.
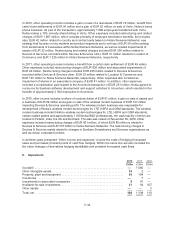
9. Acquisitions
Acquisitions completed in 2012
During 2012, the Group completed minor acquisitions that did not have a material impact on the
consolidated financial statements. The purchase consideration paid and the total of goodwill arising
from these acquisitions amounted to EUR 56 million and EUR 45 million, respectively. The goodwill
arising from these acquisitions is attributable to assembled workforce and post-acquisition synergies.
• Scalado AB, based in Lund, Sweden, provides and develops imaging software and
experiences. The Group acquired imaging specialists, all technologies and intellectual
property from Scalado AB on July 20, 2012.
• earthmine Inc., based in California, USA, develops systems to collect and process 3D
imagery. The Group acquired a 100% ownership interest in earthmine on November 19, 2012.
F-37