Nokia 2012 Annual Report Download - page 205
Download and view the complete annual report
Please find page 205 of the 2012 Nokia annual report below. You can navigate through the pages in the report by either clicking on the pages listed below, or by using the keyword search tool below to find specific information within the annual report.-
 1
1 -
2
-
3
-
4
-
5
-
6
-
7
-
8
-
9
-
10
-
11
-
12
-
13
-
14
-
15
-
16
-
17
-
18
-
19
-
20
-
21
-
22
-
23
-
24
-
25
-
26
-
27
-
28
-
29
-
30
-
31
-
32
-
33
-
34
-
35
-
36
-
37
-
38
-
39
-
40
-
41
-
42
-
43
-
44
-
45
-
46
-
47
-
48
-
49
-
50
-
51
-
52
-
53
-
54
-
55
-
56
-
57
-
58
-
59
-
60
-
61
-
62
-
63
-
64
-
65
-
66
-
67
-
68
-
69
-
70
-
71
-
72
-
73
-
74
-
75
-
76
-
77
-
78
-
79
-
80
-
81
-
82
-
83
-
84
-
85
-
86
-
87
-
88
-
89
-
90
-
91
-
92
-
93
-
94
-
95
-
96
-
97
-
98
-
99
-
100
-
101
-
102
-
103
-
104
-
105
-
106
-
107
-
108
-
109
-
110
-
111
-
112
-
113
-
114
-
115
-
116
-
117
-
118
-
119
-
120
-
121
-
122
-
123
-
124
-
125
-
126
-
127
-
128
-
129
-
130
-
131
-
132
-
133
-
134
-
135
-
136
-
137
-
138
-
139
-
140
-
141
-
142
-
143
-
144
-
145
-
146
-
147
-
148
-
149
-
150
-
151
-
152
-
153
-
154
-
155
-
156
-
157
-
158
-
159
-
160
-
161
-
162
-
163
-
164
-
165
-
166
-
167
-
168
-
169
-
170
-
171
-
172
-
173
-
174
-
175
-
176
-
177
-
178
-
179
-
180
-
181
-
182
-
183
-
184
-
185
-
186
-
187
-
188
-
189
-
190
-
191
-
192
-
193
-
194
-
 195
195 -
 196
196 -
 197
197 -
 198
198 -
 199
199 -
 200
200 -
 201
201 -
 202
202 -
 203
203 -
 204
204 -
 205
205 -
 206
206 -
 207
207 -
 208
208 -
 209
209 -
 210
210 -
 211
211 -
 212
212 -
 213
213 -
 214
214 -
 215
215 -
216
-
217
-
218
-
219
-
220
-
221
-
222
-
223
-
224
-
225
-
226
-
227
-
228
-
229
-
230
-
231
-
232
-
233
-
234
-
235
-
236
-
237
-
238
-
239
-
240
-
241
-
242
-
243
-
244
-
245
-
246
-
247
-
248
-
249
-
250
-
251
-
252
-
253
-
254
-
255
-
256
-
257
-
258
-
259
-
260
-
261
-
262
-
263
-
264
-
265
-
266
-
267
-
268
-
269
-
270
-
271
-
272
-
273
-
274
-
275
-
276
-
277
-
278
-
279
-
280
-
281
-
282
-
283
-
284
 |
 |

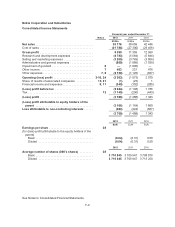
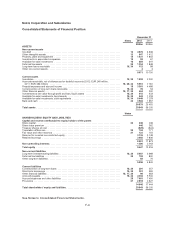
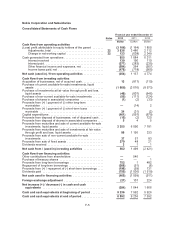
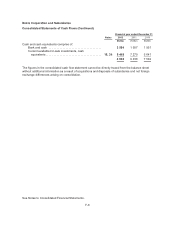
Nokia Corporation and Subsidiaries
Consolidated Statements of Financial Position
December 31
Notes 2012 2011
EURm EURm
ASSETS
Non-current assets
Goodwill .......................................................................... 13 4 876 4838
Other intangible assets ............................................................. 13 647 1412
Property, plant and equipment ....................................................... 14 1 431 1 842
Investments in associated companies ................................................. 15 58 67
Available-for-sale investments ....................................................... 16 689 641
Deferred tax assets ................................................................ 25 1 254 1 848
Long-term loans receivable .......................................................... 16, 34 112 99
Other non-current assets ............................................................ 43
9 071 10 750
Current assets
Inventories ........................................................................ 18, 20 1 538 2 330
Accounts receivable, net of allowances for doubtful accounts (2012: EUR 248 million,
2011: EUR 284 million) ........................................................... 16, 20, 34 5 551 7 181
Prepaid expenses and accrued income ................................................ 19 3 381 4 488
Current portion of long-term loans receivable ........................................... 16, 34 35 54
Other financial assets ............................................................... 16, 17, 35 464 500
Investments at fair value through profit and loss, liquid assets ............................. 16, 34 415 433
Available-for-sale investments, liquid assets ............................................ 16, 34 542 1 233
Available-for-sale investments, cash equivalents ........................................ 16, 34 5 448 7 279
Bank and cash .................................................................... 34 3 504 1 957
20 878 25 455
Total assets ...................................................................... 29 949 36 205
Notes
SHAREHOLDERS’ EQUITY AND LIABILITIES
Capital and reserves attributable to equity holders of the parent
Share capital ...................................................................... 23 246 246
Share issue premium ............................................................... 446 362
Treasury shares, at cost ............................................................ (629) (644)
Translation differences .............................................................. 22 744 771
Fair value and other reserves ........................................................ 21 123 154
Reserve for invested non-restricted equity .............................................. 3 136 3 148
Retained earnings ................................................................. 3 995 7 836
8 061 11 873
Non-controlling interests .......................................................... 1 386 2 043
Total equity ...................................................................... 9 447 13 916
Non-current liabilities
Long-term interest-bearing liabilities ................................................... 16, 34 5 087 3 969
Deferred tax liabilities ............................................................... 25 700 800
Other long-term liabilities ............................................................ 69 76
5 856 4 845
Current liabilities
Current portion of long-term loans .................................................... 16, 34 201 357
Short-term borrowings .............................................................. 16, 34 261 995
Other financial liabilities ............................................................. 16, 17, 34 90 483
Accounts payable .................................................................. 16, 34 4 394 5 532
Accrued expenses and other liabilities ................................................. 26 7 081 7 450
Provisions ........................................................................ 27 2 619 2 627
14 646 17 444
Total shareholders’ equity and liabilities ............................................. 29 949 36 205
See Notes to Consolidated Financial Statements.
F-4