Nokia 2012 Annual Report Download - page 173
Download and view the complete annual report
Please find page 173 of the 2012 Nokia annual report below. You can navigate through the pages in the report by either clicking on the pages listed below, or by using the keyword search tool below to find specific information within the annual report.-
 1
1 -
2
-
3
-
4
-
5
-
6
-
7
-
8
-
9
-
10
-
11
-
12
-
13
-
14
-
15
-
16
-
17
-
18
-
19
-
20
-
21
-
22
-
23
-
24
-
25
-
26
-
27
-
28
-
29
-
30
-
31
-
32
-
33
-
34
-
35
-
36
-
37
-
38
-
39
-
40
-
41
-
42
-
43
-
44
-
45
-
46
-
47
-
48
-
49
-
50
-
51
-
52
-
53
-
54
-
55
-
56
-
57
-
58
-
59
-
60
-
61
-
62
-
63
-
64
-
65
-
66
-
67
-
68
-
69
-
70
-
71
-
72
-
73
-
74
-
75
-
76
-
77
-
78
-
79
-
80
-
81
-
82
-
83
-
84
-
85
-
86
-
87
-
88
-
89
-
90
-
91
-
92
-
93
-
94
-
95
-
96
-
97
-
98
-
99
-
100
-
101
-
102
-
103
-
104
-
105
-
106
-
107
-
108
-
109
-
110
-
111
-
112
-
113
-
114
-
115
-
116
-
117
-
118
-
119
-
120
-
121
-
122
-
123
-
124
-
125
-
126
-
127
-
128
-
129
-
130
-
131
-
132
-
133
-
134
-
135
-
136
-
137
-
138
-
139
-
140
-
141
-
142
-
143
-
144
-
145
-
146
-
147
-
148
-
149
-
150
-
151
-
152
-
153
-
154
-
155
-
156
-
157
-
158
-
159
-
160
-
161
-
162
-
 163
163 -
 164
164 -
 165
165 -
 166
166 -
 167
167 -
 168
168 -
 169
169 -
 170
170 -
 171
171 -
 172
172 -
 173
173 -
 174
174 -
 175
175 -
 176
176 -
 177
177 -
 178
178 -
 179
179 -
 180
180 -
 181
181 -
 182
182 -
 183
183 -
184
-
185
-
186
-
187
-
188
-
189
-
190
-
191
-
192
-
193
-
194
-
195
-
196
-
197
-
198
-
199
-
200
-
201
-
202
-
203
-
204
-
205
-
206
-
207
-
208
-
209
-
210
-
211
-
212
-
213
-
214
-
215
-
216
-
217
-
218
-
219
-
220
-
221
-
222
-
223
-
224
-
225
-
226
-
227
-
228
-
229
-
230
-
231
-
232
-
233
-
234
-
235
-
236
-
237
-
238
-
239
-
240
-
241
-
242
-
243
-
244
-
245
-
246
-
247
-
248
-
249
-
250
-
251
-
252
-
253
-
254
-
255
-
256
-
257
-
258
-
259
-
260
-
261
-
262
-
263
-
264
-
265
-
266
-
267
-
268
-
269
-
270
-
271
-
272
-
273
-
274
-
275
-
276
-
277
-
278
-
279
-
280
-
281
-
282
-
283
-
284
 |
 |

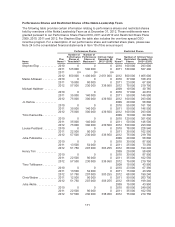
Performance Shares Restricted Shares
Name
Plan
Name(1)
Number of
Performance
Shares at
Threshold(2)
Number of
Performance
Shares at
Maximum(3)
Intrinsic Value
December 28,
2012(5) (EUR)
Plan
Name(7)
Number of
Restricted
Shares
Intrinsic Value
December 28,
2012(8) (EUR)
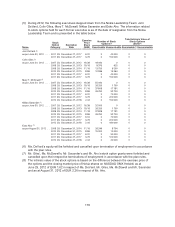
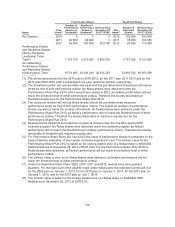
Kai Öistämö .......... 2010 0 0 0 2010 100 000 293 000
2011 22 500 90 000 0 2011 35 000 102 550
2012 45 000 180 000 263 700 2012 60 000 175 800
Performance Shares
and Restricted Shares
held by the Nokia
Leadership Team,
Total(9) ............... 1379750 5519000 5890765 2772500 8123425
All outstanding
Performance Shares
and Restricted Shares
(Global plans), Total . . . 8 574 085 34 296 340 30 634 233 23 680 532 69 383 959
(1) The performance period for the 2010 plan is 2010-2012, for the 2011 plan 2011-2013 and for the
2012 plan 2012-2013 (with a subsequent one-year restriction period), respectively.
(2) The threshold number will vest as Nokia shares should the pre-determined threshold performance
levels be met of both performance criteria. No Nokia shares were delivered under the
Performance Share Plan 2010, which would have vested in 2012, as Nokia’s performance did not
reach the threshold level of either performance criteria. Therefore the shares deliverable at
threshold equals zero for the Performance Share Plan 2010.
(3) The maximum number will vest as Nokia shares should the pre-determined maximum
performance levels be met of both performance criteria. The maximum number of performance
shares equals four times the number at threshold. No Nokia shares were delivered under the
Performance Share Plan 2010, as Nokia’s performance did not reach the threshold level of either
performance criteria. Therefore the shares deliverable at maximum equals zero for the
Performance Share Plan 2010.
(4) Represents the threshold and maximum number of shares under the one-time special CEO
incentive program. No Nokia shares were delivered under the incentive program, as Nokia’s
performance did not reach the threshold level of either performance criteria. Therefore the shares
deliverable at threshold and maximum equals zero.
(5) For Performance Share Plans 2011 and 2012 the value of performance shares is presented on the
basis of Nokia’s estimation of the number of shares expected to vest. The intrinsic value for the
Performance Share Plan 2012 is based on the closing market price of a Nokia share on NASDAQ
OMX Helsinki as at December 28, 2012 of EUR 2.93. For the Performance Share Plan 2010 no
Nokia shares were delivered, as Nokia’s performance did not reach the threshold level of either
performance criteria.
(6) The intrinsic value is zero, as no Nokia shares were delivered, as Nokia’s performance did not
reach the threshold level of either performance criteria.
(7) Under the Restricted Share Plans 2009, 2010, 2011 and 2012, awards have been granted
quarterly. For the major part of the awards made under these plans, the restriction period will end
for the 2009 plan on January 1, 2013; for the 2010 plan on January 1, 2014; for the 2011 plan on
January 1, 2015; and for the 2012 plan on July 1, 2016.
(8) The intrinsic value is based on the closing market price of a Nokia share on NASDAQ OMX
Helsinki as at December 28, 2012 of EUR 2.93.
172