Nokia 2012 Annual Report Download - page 128
Download and view the complete annual report
Please find page 128 of the 2012 Nokia annual report below. You can navigate through the pages in the report by either clicking on the pages listed below, or by using the keyword search tool below to find specific information within the annual report.-
 1
1 -
2
-
3
-
4
-
5
-
6
-
7
-
8
-
9
-
10
-
11
-
12
-
13
-
14
-
15
-
16
-
17
-
18
-
19
-
20
-
21
-
22
-
23
-
24
-
25
-
26
-
27
-
28
-
29
-
30
-
31
-
32
-
33
-
34
-
35
-
36
-
37
-
38
-
39
-
40
-
41
-
42
-
43
-
44
-
45
-
46
-
47
-
48
-
49
-
50
-
51
-
52
-
53
-
54
-
55
-
56
-
57
-
58
-
59
-
60
-
61
-
62
-
63
-
64
-
65
-
66
-
67
-
68
-
69
-
70
-
71
-
72
-
73
-
74
-
75
-
76
-
77
-
78
-
79
-
80
-
81
-
82
-
83
-
84
-
85
-
86
-
87
-
88
-
89
-
90
-
91
-
92
-
93
-
94
-
95
-
96
-
97
-
98
-
99
-
100
-
101
-
102
-
103
-
104
-
105
-
106
-
107
-
108
-
109
-
110
-
111
-
112
-
113
-
114
-
115
-
116
-
117
-
 118
118 -
 119
119 -
 120
120 -
 121
121 -
 122
122 -
 123
123 -
 124
124 -
 125
125 -
 126
126 -
 127
127 -
 128
128 -
 129
129 -
 130
130 -
 131
131 -
 132
132 -
 133
133 -
 134
134 -
 135
135 -
 136
136 -
 137
137 -
 138
138 -
139
-
140
-
141
-
142
-
143
-
144
-
145
-
146
-
147
-
148
-
149
-
150
-
151
-
152
-
153
-
154
-
155
-
156
-
157
-
158
-
159
-
160
-
161
-
162
-
163
-
164
-
165
-
166
-
167
-
168
-
169
-
170
-
171
-
172
-
173
-
174
-
175
-
176
-
177
-
178
-
179
-
180
-
181
-
182
-
183
-
184
-
185
-
186
-
187
-
188
-
189
-
190
-
191
-
192
-
193
-
194
-
195
-
196
-
197
-
198
-
199
-
200
-
201
-
202
-
203
-
204
-
205
-
206
-
207
-
208
-
209
-
210
-
211
-
212
-
213
-
214
-
215
-
216
-
217
-
218
-
219
-
220
-
221
-
222
-
223
-
224
-
225
-
226
-
227
-
228
-
229
-
230
-
231
-
232
-
233
-
234
-
235
-
236
-
237
-
238
-
239
-
240
-
241
-
242
-
243
-
244
-
245
-
246
-
247
-
248
-
249
-
250
-
251
-
252
-
253
-
254
-
255
-
256
-
257
-
258
-
259
-
260
-
261
-
262
-
263
-
264
-
265
-
266
-
267
-
268
-
269
-
270
-
271
-
272
-
273
-
274
-
275
-
276
-
277
-
278
-
279
-
280
-
281
-
282
-
283
-
284
 |
 |

Nokia Siemens Networks
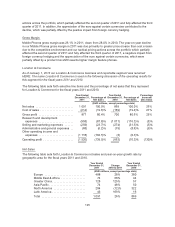
Nokia Siemens Networks completed the acquisition of the majority of Motorola Solutions’ wireless
network infrastructure assets on April 30, 2011. Accordingly, the results of Nokia Siemens Networks for
2011 are not directly comparable to 2010.
The following table sets forth selective line items and the percentage of net sales that they represent
for Nokia Siemens Networks for the fiscal years 2011 and 2010.
Year Ended
December 31,
2011
Percentage of
Net Sales
Year Ended
December 31,
2010
Percentage of
Net Sales
Percentage
Increase/
(Decrease)
(EUR millions, except percentage data)
Net sales ..................... 14041 100.0% 12 661 100.0% 11%
Cost of Sales ................. (10199) (72.6)% (9 093) (71.8)% 12%
Gross profit ................... 3842 27.4% 3 568 28.2% 8%
Research and development
expenses .................. (2 185) (15.6)% (2 137) (16.9)% 2%
Selling and marketing
expenses .................. (1 328) (9.4)% (1 307) (10.3)% 2%
Administrative and general
expenses .................. (517) (3.7)% (477) (3.8)% 8%
Other income and expenses ..... (112) (0.8)% (333) (2.6)% (66)%
Operating profit ............... (300) (2.1)% (686) (5.4)% (56)%
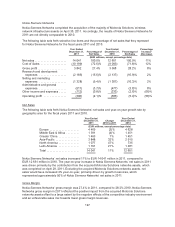
Net Sales
The following table sets forth Nokia Siemens Networks’ net sales and year-on-year growth rate by
geographic area for the fiscal years 2011 and 2010.
Year Ended
December 31,
2011
Change
2010 to 2011
Year Ended
December 31,
2010
(EUR millions, except percentage data)
Europe .................... 4469 (3)% 4 628
Middle East & Africa ......... 1391 (4)% 1 451
Greater China .............. 1465 1% 1451
Asia-Pacific ................ 3848 32% 2915
North America .............. 1077 47% 735
Latin America .............. 1791 21% 1481
Total ...................... 14041 11% 12661
Nokia Siemens Networks’ net sales increased 11% to EUR 14 041 million in 2011, compared to
EUR 12 661 million in 2010. The year-on-year increase in Nokia Siemens Networks’ net sales in 2011
was driven primarily by the contribution from the acquired Motorola Solutions networks assets, which
was completed on April 29, 2011. Excluding the acquired Motorola Solutions networks assets, net
sales would have increased 4% year-on-year, primarily driven by growth in services, which
represented approximately 50% of Nokia Siemens Networks’ net sales in 2011.
Gross Margin
Nokia Siemens Networks’ gross margin was 27.4% in 2011, compared to 28.2% 2010. Nokia Siemens
Networks gross margin in 2011 reflected the positive impact from the acquired Motorola Solutions
networks assets offset to a large extent by the negative effects of the competitive industry environment
and an unfavorable sales mix towards lower gross margin revenues.
127