Nokia 2012 Annual Report Download - page 129
Download and view the complete annual report
Please find page 129 of the 2012 Nokia annual report below. You can navigate through the pages in the report by either clicking on the pages listed below, or by using the keyword search tool below to find specific information within the annual report.-
 1
1 -
2
-
3
-
4
-
5
-
6
-
7
-
8
-
9
-
10
-
11
-
12
-
13
-
14
-
15
-
16
-
17
-
18
-
19
-
20
-
21
-
22
-
23
-
24
-
25
-
26
-
27
-
28
-
29
-
30
-
31
-
32
-
33
-
34
-
35
-
36
-
37
-
38
-
39
-
40
-
41
-
42
-
43
-
44
-
45
-
46
-
47
-
48
-
49
-
50
-
51
-
52
-
53
-
54
-
55
-
56
-
57
-
58
-
59
-
60
-
61
-
62
-
63
-
64
-
65
-
66
-
67
-
68
-
69
-
70
-
71
-
72
-
73
-
74
-
75
-
76
-
77
-
78
-
79
-
80
-
81
-
82
-
83
-
84
-
85
-
86
-
87
-
88
-
89
-
90
-
91
-
92
-
93
-
94
-
95
-
96
-
97
-
98
-
99
-
100
-
101
-
102
-
103
-
104
-
105
-
106
-
107
-
108
-
109
-
110
-
111
-
112
-
113
-
114
-
115
-
116
-
117
-
118
-
 119
119 -
 120
120 -
 121
121 -
 122
122 -
 123
123 -
 124
124 -
 125
125 -
 126
126 -
 127
127 -
 128
128 -
 129
129 -
 130
130 -
 131
131 -
 132
132 -
 133
133 -
 134
134 -
 135
135 -
 136
136 -
 137
137 -
 138
138 -
 139
139 -
140
-
141
-
142
-
143
-
144
-
145
-
146
-
147
-
148
-
149
-
150
-
151
-
152
-
153
-
154
-
155
-
156
-
157
-
158
-
159
-
160
-
161
-
162
-
163
-
164
-
165
-
166
-
167
-
168
-
169
-
170
-
171
-
172
-
173
-
174
-
175
-
176
-
177
-
178
-
179
-
180
-
181
-
182
-
183
-
184
-
185
-
186
-
187
-
188
-
189
-
190
-
191
-
192
-
193
-
194
-
195
-
196
-
197
-
198
-
199
-
200
-
201
-
202
-
203
-
204
-
205
-
206
-
207
-
208
-
209
-
210
-
211
-
212
-
213
-
214
-
215
-
216
-
217
-
218
-
219
-
220
-
221
-
222
-
223
-
224
-
225
-
226
-
227
-
228
-
229
-
230
-
231
-
232
-
233
-
234
-
235
-
236
-
237
-
238
-
239
-
240
-
241
-
242
-
243
-
244
-
245
-
246
-
247
-
248
-
249
-
250
-
251
-
252
-
253
-
254
-
255
-
256
-
257
-
258
-
259
-
260
-
261
-
262
-
263
-
264
-
265
-
266
-
267
-
268
-
269
-
270
-
271
-
272
-
273
-
274
-
275
-
276
-
277
-
278
-
279
-
280
-
281
-
282
-
283
-
284
 |
 |

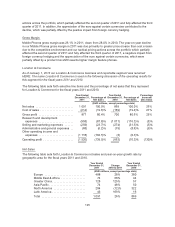
Operating Expenses
Nokia Siemens Networks’ research and development expenses increased 2% to EUR 2 185 million,
compared to EUR 2 137 million in 2010. The increase was primarily due to the addition of research and
development operations relating to the acquired Motorola Solutions’ networks assets as well as
investments in strategic initiatives.
Nokia Siemens Networks’ selling and marketing expenses, as well as administrative and general
expenses, were virtually flat year-on-year in 2011, as the increase from the acquired Motorola
Solutions networks assets was offset by ongoing cost control initiatives.
Operating Margin
Nokia Siemens Networks’ operating loss in 2011 was EUR 300 million, compared with an operating
loss of EUR 686 million in 2010. Nokia Siemens Networks’ operating margin in 2011 was negative
2.1%, compared with negative 5.4% in 2010 primarily because of higher net sales, which were offset
by higher operating expenses.
Strategy and Restructuring Program
On November 23, 2011, Nokia Siemens Networks announced its current strategy to focus on mobile
broadband and services and the launch of an extensive global restructuring program.
5B. Liquidity and Capital Resource
At December 31, 2012, our cash and other liquid assets (bank and cash; available-for-sale
investments, cash equivalents; available-for-sale investments, liquid assets; and investments at fair
value through profit and loss, liquid assets) decreased to EUR 9 909 million, compared with EUR 10
902 million at December 31, 2011, primarily due to cash outflows related to restructuring, the payment
of the dividend and cash outflows related to the net financial expenses and taxes as well as capital
expenditures. This was partially offset by positive overall net cash from operating activities, excluding
cash outflows related to restructuring, net financial expenses and taxes, as well as cash flows related
to the receipt of quarterly platform support payments from Microsoft (which commenced in the fourth
quarter 2011), proceeds from the sale of fixed assets and proceeds from the issuance of a convertible
bond. At December 31, 2010, cash and other liquid assets totaled EUR 12 275 million.
At December 31, 2012, cash and cash equivalents (bank and cash and available-for-sale investments,
cash equivalent) decreased to EUR 8 952 million, compared with EUR 9 236 million at December 31,
2011. We hold our cash and cash equivalents predominantly in euro. Cash and cash equivalents
totaled EUR 7 592 million at December 31, 2010.
Net cash used in operating activities was EUR 354 million in 2012, compared with net cash from
operating activities of EUR 1 137 million in 2011 and EUR 4 774 million in 2010. In 2012, net cash from
operating activities decreased to net cash used in operating activities primarily due to a decrease in
profitability and cash outflows relating to restructuring. In 2011, net cash from operating activities
decreased primarily due to a decrease in profitability and an increase in net working capital partially
offset by an increase in cash inflows of IPR royalty income, the receipt of a platform support payment
from Microsoft in the fourth quarter of 2011 and an increase in other financial income. Net cash from
investing activities was EUR 562 million in 2012, compared with EUR 1 499 million in 2011 and a
usage of EUR 2 421 million in 2010. Net cash from acquisitions of businesses, net of acquired cash,
was EUR 13 million, compared to net cash used in acquisitions of businesses, net of acquired cash, of
EUR 817 million in 2011 and EUR 110 million in 2010. Cash flow from investing activities in 2012
included purchases of current available-for-sale investments, liquid assets of EUR 1 668 million,
128