Nokia 2012 Annual Report Download - page 265
Download and view the complete annual report
Please find page 265 of the 2012 Nokia annual report below. You can navigate through the pages in the report by either clicking on the pages listed below, or by using the keyword search tool below to find specific information within the annual report.-
 1
1 -
2
-
3
-
4
-
5
-
6
-
7
-
8
-
9
-
10
-
11
-
12
-
13
-
14
-
15
-
16
-
17
-
18
-
19
-
20
-
21
-
22
-
23
-
24
-
25
-
26
-
27
-
28
-
29
-
30
-
31
-
32
-
33
-
34
-
35
-
36
-
37
-
38
-
39
-
40
-
41
-
42
-
43
-
44
-
45
-
46
-
47
-
48
-
49
-
50
-
51
-
52
-
53
-
54
-
55
-
56
-
57
-
58
-
59
-
60
-
61
-
62
-
63
-
64
-
65
-
66
-
67
-
68
-
69
-
70
-
71
-
72
-
73
-
74
-
75
-
76
-
77
-
78
-
79
-
80
-
81
-
82
-
83
-
84
-
85
-
86
-
87
-
88
-
89
-
90
-
91
-
92
-
93
-
94
-
95
-
96
-
97
-
98
-
99
-
100
-
101
-
102
-
103
-
104
-
105
-
106
-
107
-
108
-
109
-
110
-
111
-
112
-
113
-
114
-
115
-
116
-
117
-
118
-
119
-
120
-
121
-
122
-
123
-
124
-
125
-
126
-
127
-
128
-
129
-
130
-
131
-
132
-
133
-
134
-
135
-
136
-
137
-
138
-
139
-
140
-
141
-
142
-
143
-
144
-
145
-
146
-
147
-
148
-
149
-
150
-
151
-
152
-
153
-
154
-
155
-
156
-
157
-
158
-
159
-
160
-
161
-
162
-
163
-
164
-
165
-
166
-
167
-
168
-
169
-
170
-
171
-
172
-
173
-
174
-
175
-
176
-
177
-
178
-
179
-
180
-
181
-
182
-
183
-
184
-
185
-
186
-
187
-
188
-
189
-
190
-
191
-
192
-
193
-
194
-
195
-
196
-
197
-
198
-
199
-
200
-
201
-
202
-
203
-
204
-
205
-
206
-
207
-
208
-
209
-
210
-
211
-
212
-
213
-
214
-
215
-
216
-
217
-
218
-
219
-
220
-
221
-
222
-
223
-
224
-
225
-
226
-
227
-
228
-
229
-
230
-
231
-
232
-
233
-
234
-
235
-
236
-
237
-
238
-
239
-
240
-
241
-
242
-
243
-
244
-
245
-
246
-
247
-
248
-
249
-
250
-
251
-
252
-
253
-
254
-
 255
255 -
 256
256 -
 257
257 -
 258
258 -
 259
259 -
 260
260 -
 261
261 -
 262
262 -
 263
263 -
 264
264 -
 265
265 -
 266
266 -
 267
267 -
 268
268 -
 269
269 -
 270
270 -
 271
271 -
 272
272 -
 273
273 -
 274
274 -
 275
275 -
276
-
277
-
278
-
279
-
280
-
281
-
282
-
283
-
284
 |
 |

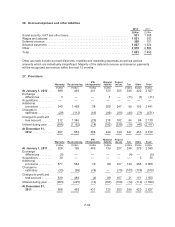
Provisions for losses on projects in progress are related to Nokia Siemens Networks’ onerous contracts.
Utilization of provisions for project losses is generally expected to occur in the next 12 months.
Other provisions include provisions for various contractual obligations and provisions for pension and
other social security costs on share-based awards.
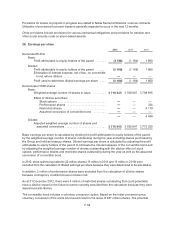
28. Earnings per share
2012 2011 2010
Numerator/EURm
Basic:
Profit attributable to equity holders of the parent ....... (3 106) (1 164) 1 850
Diluted:
Profit attributable to equity holders of the parent ....... (3 106) (1 164) 1 850
Elimination of interest expense, net of tax, on convertible
bond, where dilutive ............................ ———
Profit used to determine diluted earnings per share .... (3 106) (1 164) 1 850
Denominator/1000 shares
Basic:
Weighted average number of shares in issue ......... 3 710 845 3 709 947 3 708 816
Effect of dilutive securities:
Stock options ................................ ———
Performance shares .......................... —— 324
Restricted shares ............................ —— 4 110
Assumed conversion of convertible bond ......... ———
—— 4 434
Diluted:
Adjusted weighted average number of shares and
assumed conversions ........................... 3 710 845 3 709 947 3 713 250
Basic earnings per share is calculated by dividing the profit attributable to equity holders of the parent
by the weighted average number of shares outstanding during the year excluding shares purchased by
the Group and held as treasury shares. Diluted earnings per share is calculated by adjusting the profit
attributable to equity holders of the parent to eliminate the interest expense of the convertible bond and
by adjusting the weighted average number of shares outstanding with the dilutive effect of stock
options, performance shares and restricted shares outstanding during the year as well as the assumed
conversion of convertible bond.
In 2012, stock options equivalent to 22 million shares (16 million in 2011 and 13 million in 2010) were
excluded from the calculation of diluted earnings per share because they were determined to be anti-dilutive.
In addition, 2 million of performance shares were excluded from the calculation of dilutive shares
because contingency conditions have not been met.
As at 31 December 2012, there were 4 million of restricted shares outstanding that could potentially
have a dilutive impact in the future but were currently excluded from the calculation because they were
determined anti-dilutive.
The convertible bond includes a voluntary conversion option. Based on the initial conversion price,
voluntary conversion of the entire bond would result in the issue of 287 million shares. The potential
F-64