Nokia 2012 Annual Report Download - page 109
Download and view the complete annual report
Please find page 109 of the 2012 Nokia annual report below. You can navigate through the pages in the report by either clicking on the pages listed below, or by using the keyword search tool below to find specific information within the annual report.-
 1
1 -
2
-
3
-
4
-
5
-
6
-
7
-
8
-
9
-
10
-
11
-
12
-
13
-
14
-
15
-
16
-
17
-
18
-
19
-
20
-
21
-
22
-
23
-
24
-
25
-
26
-
27
-
28
-
29
-
30
-
31
-
32
-
33
-
34
-
35
-
36
-
37
-
38
-
39
-
40
-
41
-
42
-
43
-
44
-
45
-
46
-
47
-
48
-
49
-
50
-
51
-
52
-
53
-
54
-
55
-
56
-
57
-
58
-
59
-
60
-
61
-
62
-
63
-
64
-
65
-
66
-
67
-
68
-
69
-
70
-
71
-
72
-
73
-
74
-
75
-
76
-
77
-
78
-
79
-
80
-
81
-
82
-
83
-
84
-
85
-
86
-
87
-
88
-
89
-
90
-
91
-
92
-
93
-
94
-
95
-
96
-
97
-
98
-
 99
99 -
 100
100 -
 101
101 -
 102
102 -
 103
103 -
 104
104 -
 105
105 -
 106
106 -
 107
107 -
 108
108 -
 109
109 -
 110
110 -
 111
111 -
 112
112 -
 113
113 -
 114
114 -
 115
115 -
 116
116 -
 117
117 -
 118
118 -
 119
119 -
120
-
121
-
122
-
123
-
124
-
125
-
126
-
127
-
128
-
129
-
130
-
131
-
132
-
133
-
134
-
135
-
136
-
137
-
138
-
139
-
140
-
141
-
142
-
143
-
144
-
145
-
146
-
147
-
148
-
149
-
150
-
151
-
152
-
153
-
154
-
155
-
156
-
157
-
158
-
159
-
160
-
161
-
162
-
163
-
164
-
165
-
166
-
167
-
168
-
169
-
170
-
171
-
172
-
173
-
174
-
175
-
176
-
177
-
178
-
179
-
180
-
181
-
182
-
183
-
184
-
185
-
186
-
187
-
188
-
189
-
190
-
191
-
192
-
193
-
194
-
195
-
196
-
197
-
198
-
199
-
200
-
201
-
202
-
203
-
204
-
205
-
206
-
207
-
208
-
209
-
210
-
211
-
212
-
213
-
214
-
215
-
216
-
217
-
218
-
219
-
220
-
221
-
222
-
223
-
224
-
225
-
226
-
227
-
228
-
229
-
230
-
231
-
232
-
233
-
234
-
235
-
236
-
237
-
238
-
239
-
240
-
241
-
242
-
243
-
244
-
245
-
246
-
247
-
248
-
249
-
250
-
251
-
252
-
253
-
254
-
255
-
256
-
257
-
258
-
259
-
260
-
261
-
262
-
263
-
264
-
265
-
266
-
267
-
268
-
269
-
270
-
271
-
272
-
273
-
274
-
275
-
276
-
277
-
278
-
279
-
280
-
281
-
282
-
283
-
284
 |
 |

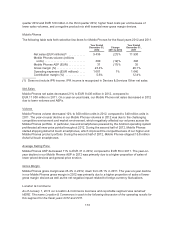
settlements of EUR 56 million, a net gain on sale of Vertu business of EUR 52 million and a net gain on
sale of real estate of EUR 79 million. In 2011, other income and expenses included restructuring
charges of EUR 626 million, impairment of assets of EUR 90 million, consideration related to the
Accenture transaction of EUR 251 million, impairment of shares in an associated company of
EUR 41 million and a benefit from a cartel claim settlement of EUR 49 million.
Operating Margin
Our 2012 operating loss was EUR 2 303 million, compared with an operating loss of EUR 1 073 million
in 2011. The increased operating loss resulted primarily from restructuring charges and associated
items of EUR 1.8 billion, a decrease in the operating performance of our Devices & Services business,
which was partially offset by an increase in the operating performance of Nokia Siemens Networks.
Our 2012 operating margin was negative 7.6% compared to negative 2.8% in 2011. Our operating loss
in 2012 included purchase price accounting items, restructuring charges and other special items of net
negative EUR 2.4 billion compared to net negative EUR 2.9 billion in 2011.
Corporate Common
Corporate Common Functions’ expenses totaled EUR 103 million in 2012, compared to
EUR 131 million in 2011.
Net Financial Income and Expenses
Financial income and expenses, net, was an expense of EUR 340 million in 2012 compared to an
expense of EUR 102 million in 2011. The higher net expense in 2012 was primarily driven by foreign
exchange losses. Nokia expects financial income and expenses, net, in 2013 to be an expense of
approximately EUR 300 million.
Our net debt to equity ratio was negative 46% at December 31, 2012, compared with a net debt to
equity ratio of negative 40% at December 31, 2011. See Item 5B. “Liquidity and Capital Resources”
below.
Profit Before Taxes
Loss before tax was EUR 2 644 million in 2012, compared to a loss of EUR 1 198 million in 2011.
Taxes amounted to EUR 1 145 million in 2012 and EUR 290 million in 2011. Nokia taxes continued to
be unfavorably affected by Nokia Siemens Networks taxes as no tax benefits are recognized for certain
Nokia Siemens Networks deferred tax items. Additionally, in 2012, Nokia taxes were adversely affected
by allowances related to Devices & Services’ Finnish deferred tax assets and discontinuation of
recognizing tax benefits for Devices & Services’ Finnish deferred tax items due to uncertainty of
utilization of these items.
Non-controlling interests
Loss attributable to non-controlling interests totaled EUR 683 million in 2012, compared with a loss
attributable to non-controlling interests of EUR 324 million in 2011. This change was primarily due to a
increase in Nokia Siemens Networks’ losses.
Profit Attributable to Equity Holders of the Parent and Earnings per Share
Loss attributable to equity holders of the parent in 2012 totaled EUR 3 106 million, compared with a
loss of EUR 1 164 million in 2011. Earnings per share in 2012 decreased to EUR (0.84) (basic) and
EUR (0.84) (diluted), compared with EUR (0.31) (basic) and EUR (0.31) (diluted) in 2011.
108